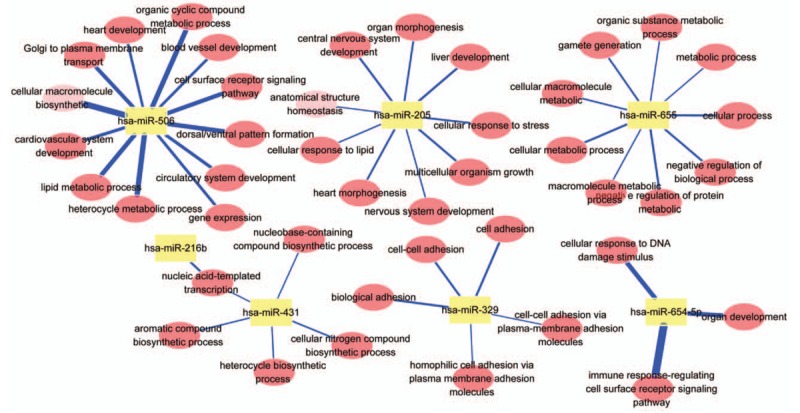
Figure 5.

GO-Tree: red circles represent the BP involved in GO terms, and yellow squares represent miRNA in GO terms. Blue lines represent P values.

GO-Tree: red circles represent the BP involved in GO terms, and yellow squares represent miRNA in GO terms. Blue lines represent P values.