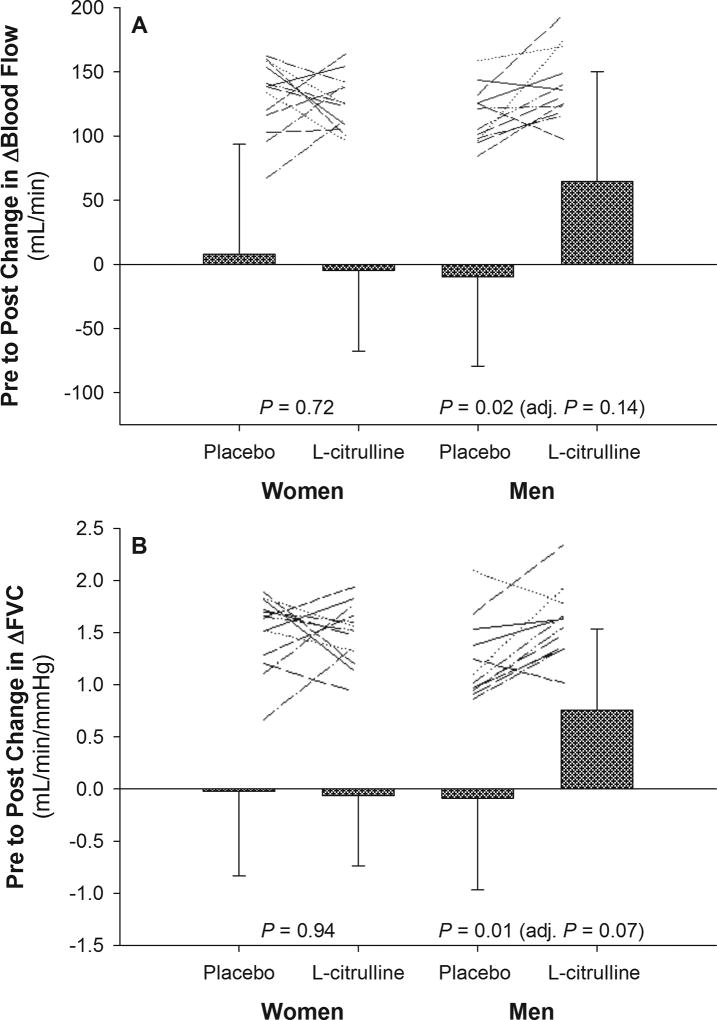
Figure 1.
Change in blood flow and femoral vascular conductance (FVC) expressed as an increase from rest to exercise (Δ) following placebo and L-citrulline conditions. Only data for the 1.5 kg workload condition is presented. Data are mean ± SD. Lines represent non-scaled individual responses. P values are from statistical comparisons of the change values between conditions after controlling for sequence and period effects in a crossover design. The P value in parentheses is adjusted for BMI and baseline diastolic pressure in addition to sequence and period effects.

