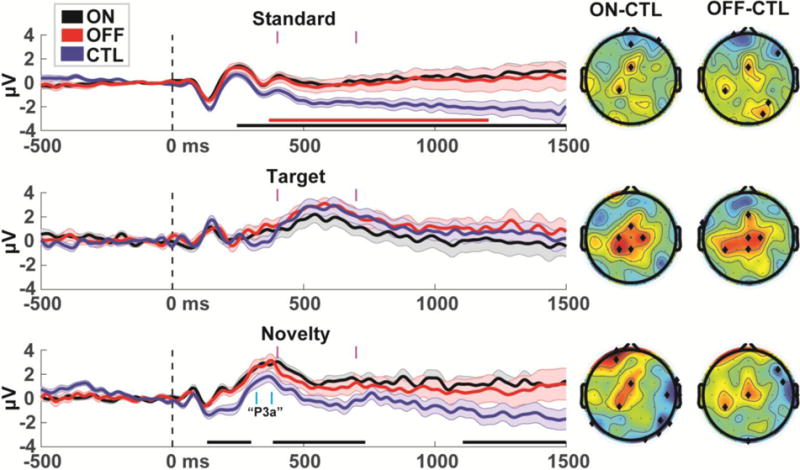
Figure 1.

ERPs in individuals with Parkinson’s disease ON and OFF medication vs. a well-matched CTL group. Standard and Novel ERPs are from the FCz electrode, Target ERPs are from POz. Horizontal bars under each ERP indicate permutation-corrected statistically significant differences between PD and CTL (black=ON>CTL, red=OFF>CTL). Major differences between groups occurred over much of the duration of standard and novel trials. PD and CTL groups reliably differed in frontal midline electrodes regardless of medication status. The time range of the P3a is marked in cyan. Topoplots are shown in time ranges indicated by vertical magenta bars (400-700 ms), significant differences are indicated by black diamonds. Error bars are _+/− SEM
