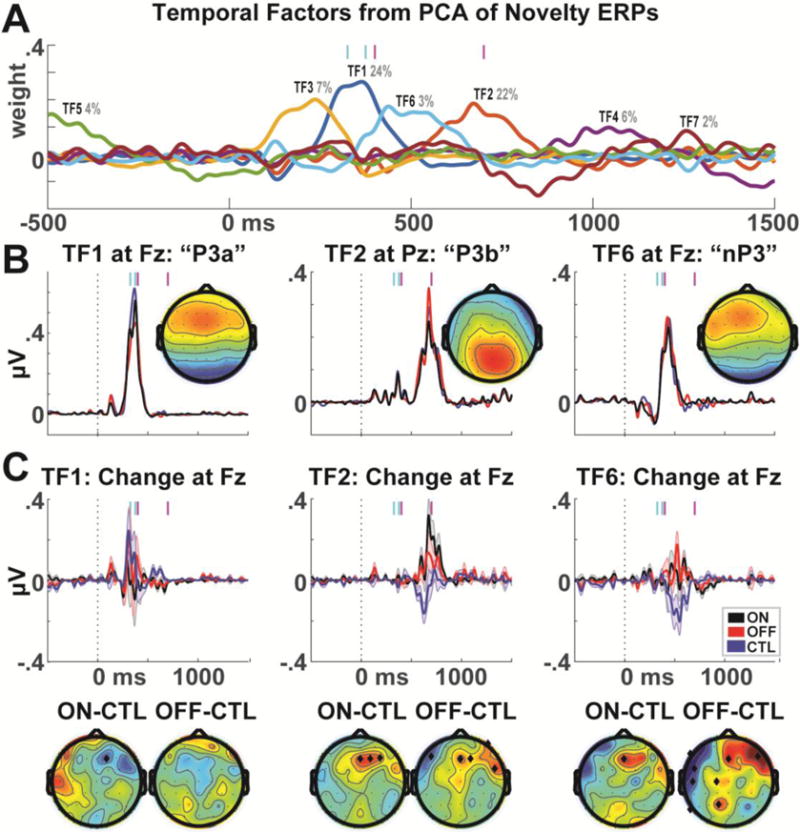
Figure 4.

Principal components analysis of novelty condition ERPs. A) A seven-factor solution with promax rotation revealed three major temporal factors in the relevant time ranges. Cyan bars represent the P3a time range; magenta bars represent the time range of major habituation effects. B) TF1 corresponded to the P3a time range and had a frontal midline maximum. TF2 corresponded to a P3b time range and had a parietal midline maximum. TF6 had a late time range and corresponded to a frontal midline maximum; this may reflect a novelty P3 component. C) When the TF weights for each different component were applied to the difference between the first 1/3 minus last 1/3 trials, the previously observed pattern of results is observed for both TF2 and TF6, suggesting that this altered brain dynamic is not specific to a specific ERP component. Error bars are _+/− SEM. Topoplots are shown in time ranges indicated by vertical magenta bars, significant differences are indicated by black diamonds.
