
Figure 7.
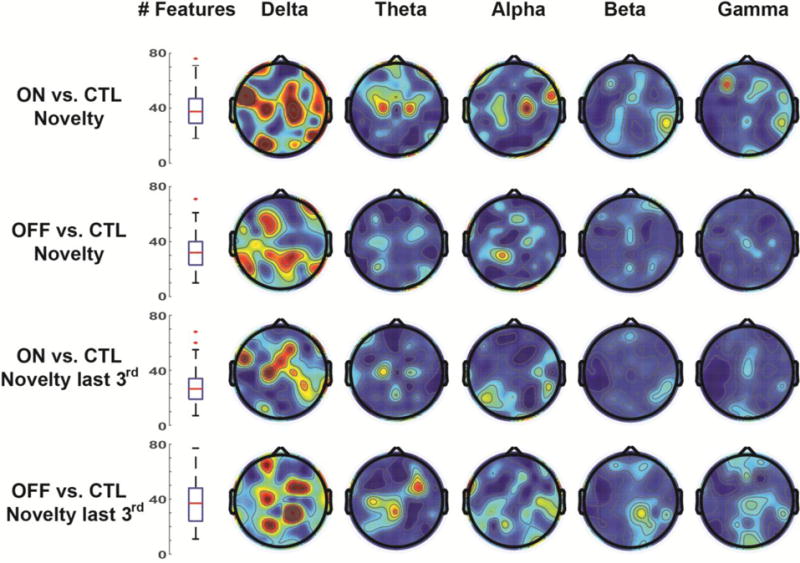
Maximally discriminating features after iterative reduction. For each of four major contrasts (rows), features were removed from the classification if they did not contribute to overall accuracy. Over 50 permutations, each contrast relied on a median of ~30 features for accurate classification. Topoplots show the average number of discriminating features, which were primarily in the delta band over midline areas. Topoplots are all scaled from 0 (blue) to .05 (red).