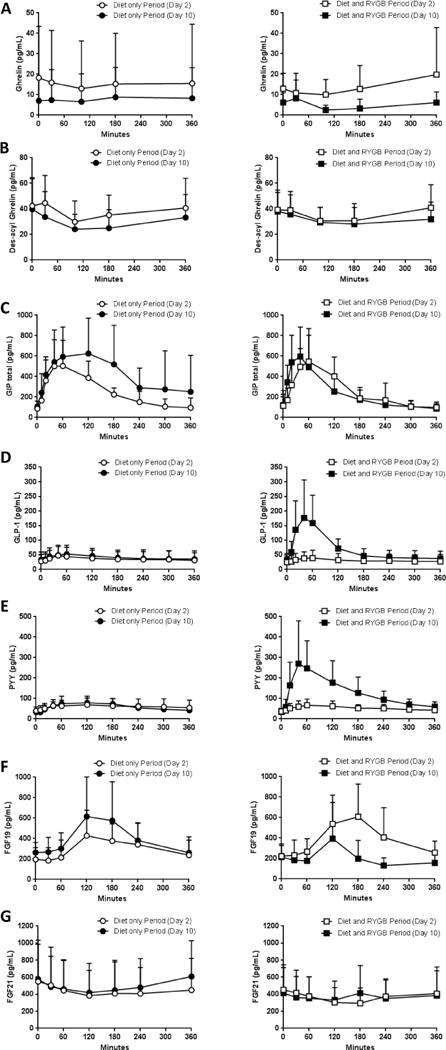
Figure 2.

Results of acyl ghrelin (A), des-acyl ghrelin (B), GIP (C), GLP-1 (D), PYY (F), FGF19 (G), and FGF21 (H) measured during the 6-h MMCT following the period of caloric restriction alone (left column, Diet only Period) vs identical caloric restriction alongside with RYGB (right column, Diet and RYGB Period); open circles (○) indicates day 2 in Diet only Period, filled circles (●) indicates day 10 in Diet only Period, open squares (□) indicates day 2 in Diet and RYGB Period, filled squares (■) indicates day 10 in Diet and RYGB Period. Plotted values are presented as mean ± SD
FGF – fibroblast growth factor, GIP – gastric inhibitory polypeptide, GLP-1 – glucagon like peptide 1, MMCT – mixed meal challenge test, PYY – peptide YY, RYGB - Roux-en-Y gastric bypass
