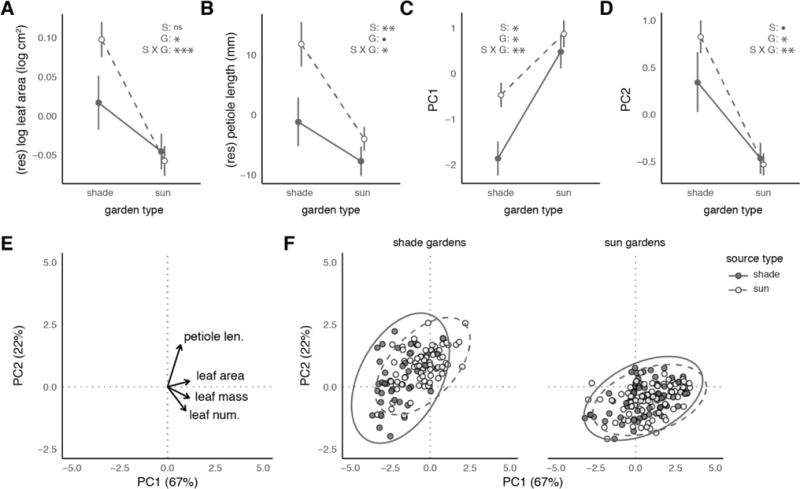
Fig. 1. Foliar phenotypes are differentiated between bittercress from sun and shade source habitats when grown in shade gardens.

Sun source plants exhibit increased leaf area (A) and petiole length (B) compared to shade source plants when grown in shade gardens, independent of overall plant size and the mass of focal leaves (see Methods). Principal components analysis (PCA; E–F) reveals average differences in PC1 (C) and PC2 (D) shade gardens but not sun gardens. E. Vector loadings of four log-transformed input trait vectors, with leaf area and petiole length largely oriented towards upper right quadrant. P-values correspond to source (‘S’), garden (‘G’), or source × garden (‘S × G’) effects in Table 3. F. 95% ellipsoids are drawn around data points from each source type.
