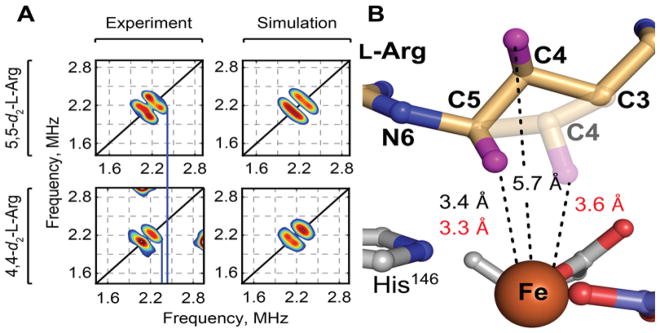
Figure 6.
Analysis of substrate positioning in NapI by HYSCORE spectroscopy on its EPR-active, S = 3/2 iron-nitrosyl {FeNO}7 complex. A, Comparison of HYSCORE spectra (left) and simulations (right), collected at 330 mT on samples of NapI•{FeNO}7•2OG•5,5-d2-L-Arg (top) and NapI•{FeNO}7•2OG•4,4-d2-L-Arg (bottom). Spectra were collected with a microwave frequency of 9.77 GHz at a temperature of 4.0 K. Experimental conditions and simulation parameters are given in the legends to Figures S10 and S11. B, Comparison of distances obtained by x-ray crystallography (black) and HYSCORE spectroscopy (red), and structural models based on these distances. The transparent C3–C5 segment is based on the HYSCORE results. Hydrogens are shown as purple spheres.

