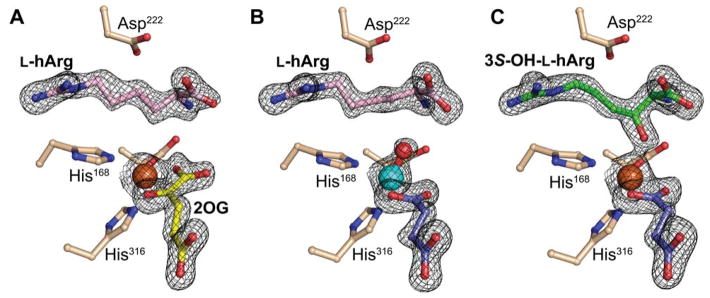
Figure 8.
X-ray crystal structures of VioC complexes revealing changes in the conformation of the substrate/product side chain through the reaction cycle. A, Reactant complex with Fe(II) (orange), 2OG (yellow), and L-hArg (pink). B, Complex with vanadium [cyan; (hydr)oxo shown in red], succinate (purple), and L-hArg (pink). C, Complex after exposure of crystals of the reactant complex to O2 showing electron density consistent with formation of (3S)-OH-L-hArg (green) (color coding of other ligands as in A). In all structures, a 2Fo-Fc electron density map for selected active site components is shown in black mesh and contoured to 1.5 σ.

