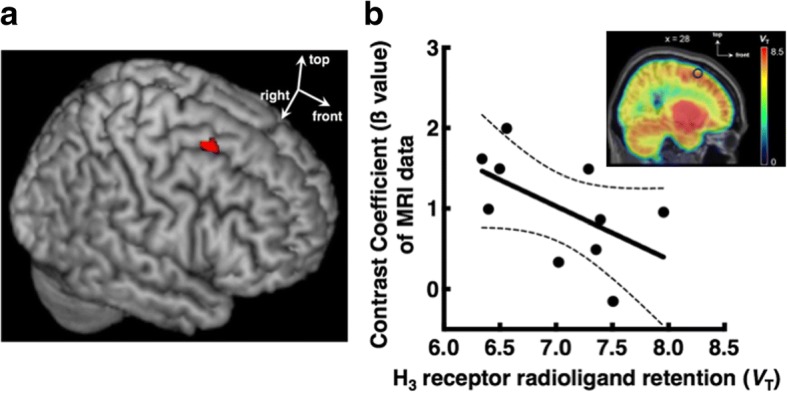
Fig. 1.

a Group map showing the activity in the right middle frontal gyrus (red, x, y, z = 28, 10, 60) in response to increased working memory load. b The activity in the right middle frontal gyrus was negatively correlated with the H3 receptor radioligand retention (VT), which reflects the H3 receptor density. The dashed lines indicate 95% confidence intervals. The PET image on the graph indicates the distribution of the H3 receptors in the brain. The sagittal image was obtained by averaging parametric images of the 10 subjects. The parametric images were calculated using Ichise’s multilinear analysis to estimate total distribution volume for each voxel and spatially normalised thereafter. The circle indicates the location of the activated region detected in fMRI during performing working memory task in the right middle frontal gyrus shown in a
