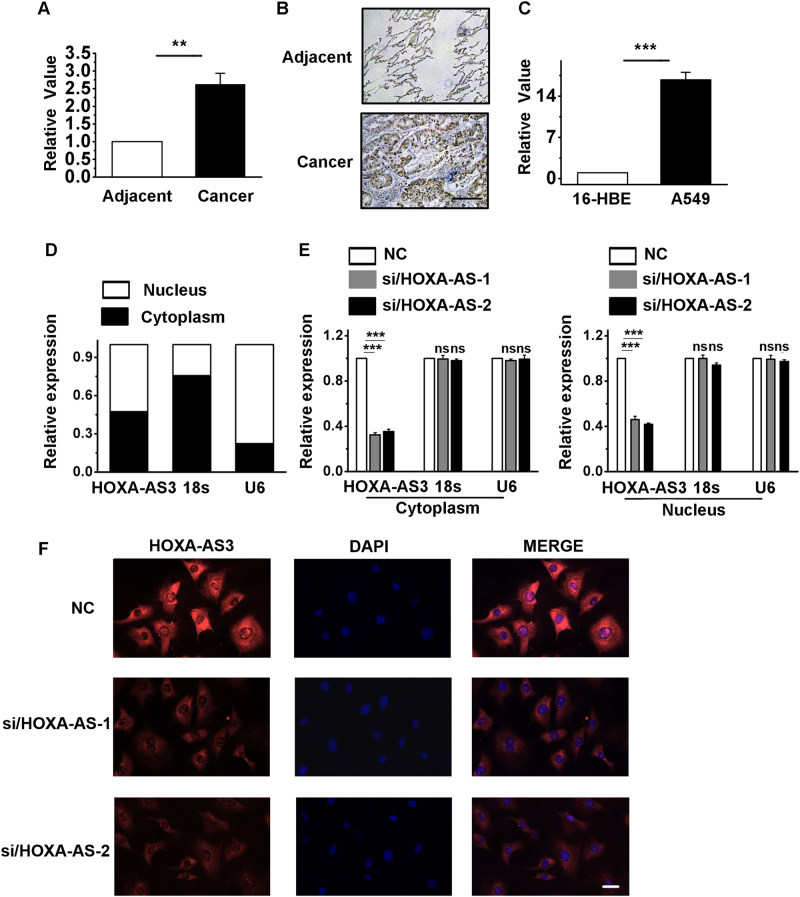
Fig. 1. The expression of HOXA-AS3 in lung adenocarcinoma (LAD) and A549 cells.
a Expression of HOXA-AS3 quantified by the quantitative polymerase chain reaction (qRT-PCR) in LAD samples and their corresponding adjacent normal tissues. b In situ hybridization of HOXA-AS3 RNA expression in tumor tissue samples of LAD. Scale bar, 50 μm. c Expression of HOXA-AS3 quantified by qRT-PCR in human LAD cell line, A549, and in a normal bronchial epithelial cell line, 16HBE. d Representative analysis of the HOXA-AS3 distribution by cellular fractionation in A549 cells. U6 mRNA and 18 s mRNA were controls for nuclear and cytoplasmic RNAs, respectively. e Expression of HOXA-AS3 quantified by the qRT-PCR in the nuclear and cytoplasmic fractions from NC and siRNA/HOXA-AS3 cells. f RNA-fluorescent in situ hybridization (FISH) was performed to detect HOXA-AS3 expression in A549 cells. The nuclei were counterstained with 4′,6-diamidino-2-phenylindole (DAPI). Scale bar, 50 μm. Adjacent, LAD-corresponding to adjacent normal tissue; cancer, LAD tissue; *P < 0.05, **P < 0.01, and ***P < 0.001. All of the values are expressed as the mean ± SEM

