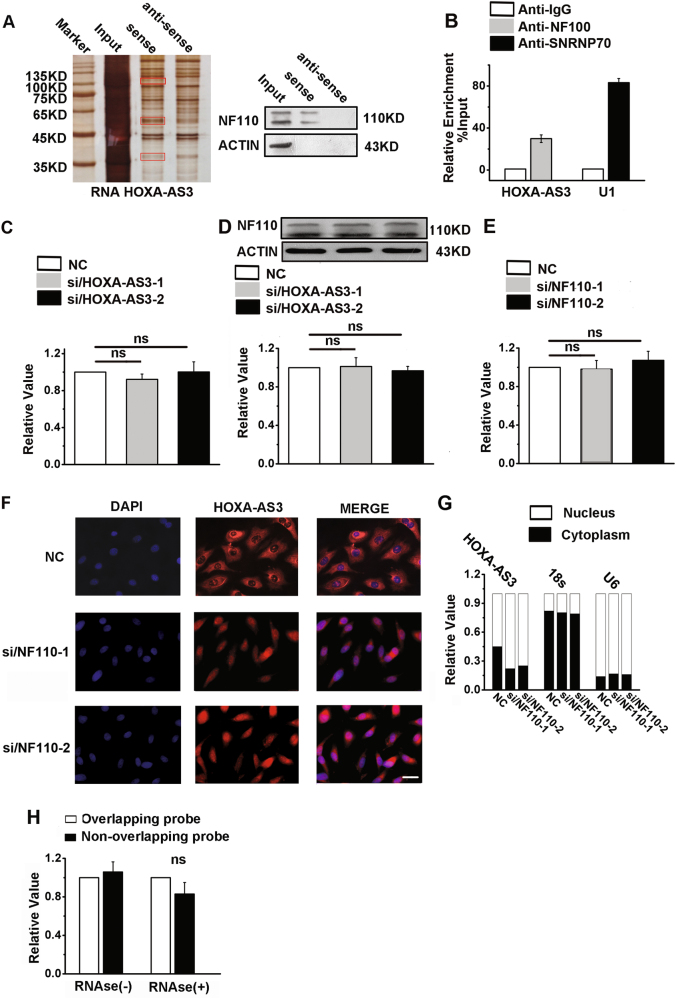
Fig. 7. HOXA-AS3 interacts with NF110.
a Left, identification of HOXA-AS3-associated target proteins in A549 cells using a RNA pull-down assay. The bands specific to sense HOXA-AS3 were detected using mass spectrometry. Right, western blot analyses of the interaction of HOXA-AS3 with NF110. b RNA immunoprecipitation experiments were performed using NF110 antibody, SNRNP70 antibody and IgG antibody in A549 cells. qRT-PCR was performed to detect pulled-down HOXA-AS3 and U1. SNRNP70 antibody and IgG antibody were used as positive and negative controls, respectively. c Expression of NF110 quantified by qRT-PCR after HOXA-AS3 knockdown in A549 cells. d Western blot analyses of the protein expression levels of NF110 after HOXA-AS3 knockdown in A549 cells. e Expression of HOXA-AS3 quantified by qRT-PCR after NF110 knockdown in A549 cells. f RNA-FISH was performed to detect HOXA-AS3 expression in A549 cells. Nuclei were counterstained with DAPI. Scale bar, 25 μM. g Representative analysis of HOXA-AS3 distribution by cellular fractionation of A549 cells. U6 mRNA and 18 s mRNA were the controls for nuclear and cytoplasmic RNAs, respectively. h RPA performed on RNA samples from A549 cells that knocked down NF110. Depicted are qRT-PCR results from two sets of primers and probes covering overlapping and nonoverlapping regions of HOXA6 mRNA. NC, negative control; siRNA/HOXA-AS3, small interfering RNA for HOXA-AS3; siRNA/NF110, small interfering RNA for NF110. *P < 0.05, **P < 0.01, and ***P < 0.001. All values are expressed as the mean ± SEM

