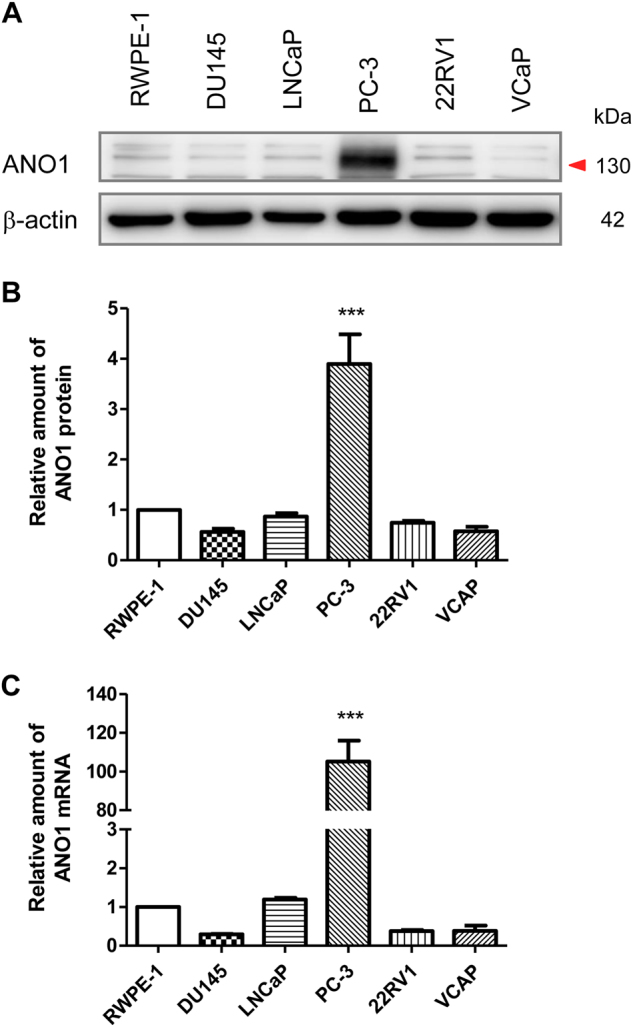
Fig. 1. Comparison of ANO1 expression levels in different prostate cancer cell lines.

a Immunoblot analysis of endogenous ANO1 expression in normal prostate epithelial cells (RWPE-1) and prostate cancer cell lines (DU145, LNCaP, PC-3, 22RV1, and VCaP) by western blot. The expression of ANO1 protein was normalized to the expression level of β-actin. b Quantitative analysis of ANO1 protein expression in cell lines from a. The ANO1 protein level is increased fourfold in PC-3 cells, as compared with that of RWPE-1 cells. c Quantitative real time PCR analysis of ANO1 mRNA levels in RWPE-1, DU145, LNCaP, PC-3, 22RV1, and VCaP cells. The ANO1 mRNA level is increased 100-fold in PC-3 cells, as compared with that of RWPE-1 cells. All data are shown as the means ± SEM (n = 4 independent experiments). The statistical significance between groups is indicated as *** p < 0.001
