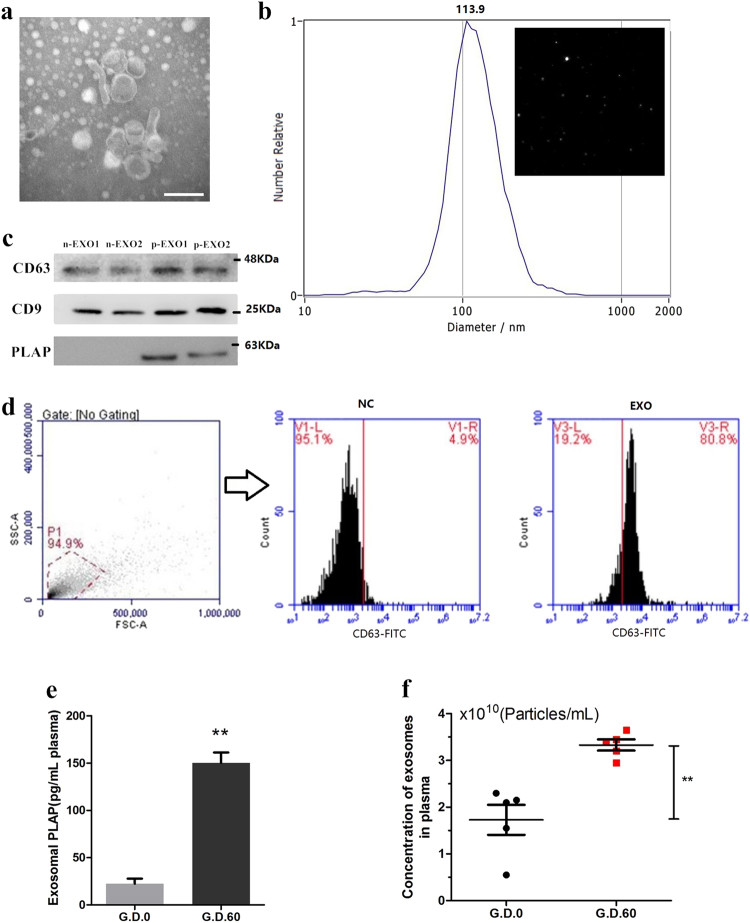
Fig. 1. Isolation and characterization of placenta-specific exosomes.
a Electron micrograph showing whole-mount exosomes isolated from the plasma of cows (scale bar, 200 nm). b Particle size distribution in exosome-enriched fractions. Insert: Light scatter from isolated particles. c Western blot analysis showing exosome marker CD63, CD9, and placenta-specific exosome maker PLAP in exosome-enriched fractions isolated from healthy cow plasma at gestational day 0 and 60. d Flow cytometric analysis of CD63 expression in exosome-enriched fractions (e) ELISA quantification of CD63-positive particles in exosome-enriched fractions isolated from healthy cow plasma at gestational day 0 and 60. f NTA analysis showing the concentration of plasma exosomes isolated from healthy cow plasma at gestational day 0 and 60. G_D.0 and G_D.60 represent gestational day 0 and 60, respectively. n-EXO and p-EXO represent exosomes isolated from cow plasma at G_D.0 and G_D.60, respectively. NC represents the negative control (PBS solution). Data represent three independent experiments and are presented as the mean ± S.E.M (error bars). Two-tailed Student’s t-test, *P < 0.05; **P < 0.01

