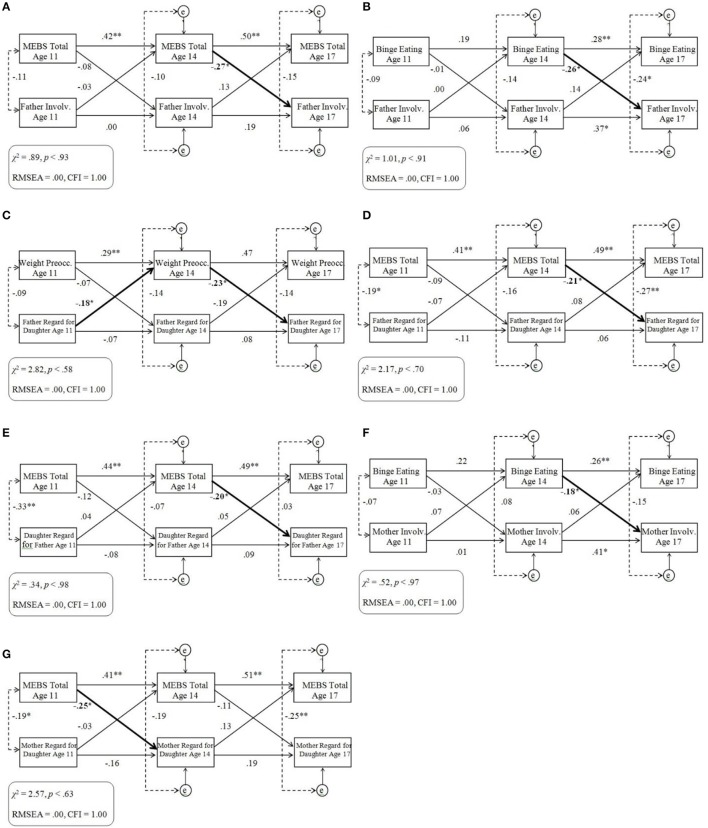
Figure 3.
(A–G) Cross-lagged models of eating pathology and twin ratings of the parent-child relationship within the discordant sample. Standardized across-age path coefficients are illustrated by single-headed arrows; within-age correlations are illustrated by dotted lines. Significant cross-lagged associations are denoted in bold. MEBS, Minnesota Eating Behaviors Survey; Involv., Involvement; Preocc., Preoccupation; e, residual variance at ages 14 and 17 years; RMSEA, root mean square error of approximation; CFI, comparative fit index. *p < 0.05, **p < 0.01.

