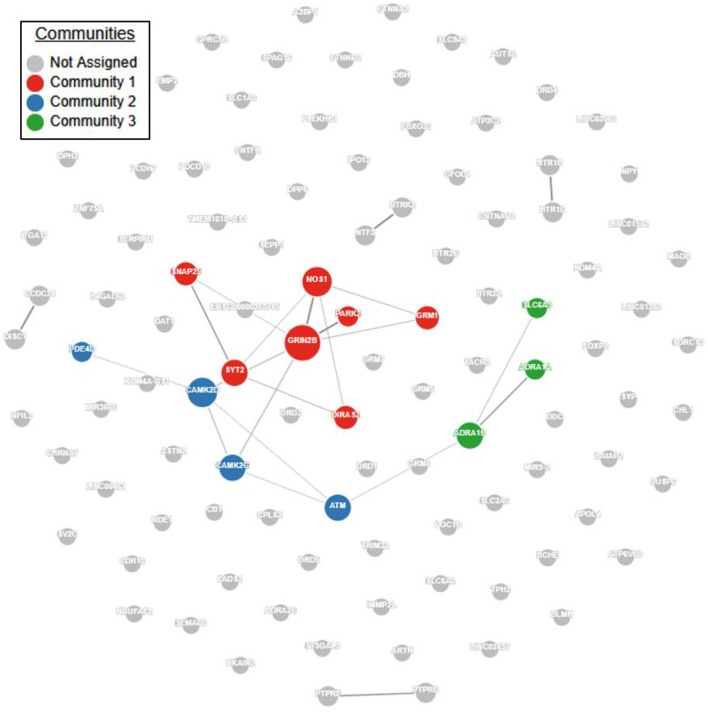
Figure 1.
ADHD candidate gene network interaction analysis. Using the GeNets network analysis tool (https://apps.broadinstitute.org/genets), we mapped all 105 ADHD candidate genes obtained from the literature (see Supplementary Table S1) onto the InWeb3 meta-network to determine whether they are functionally connected. The density of the mapped network (density = number of edges/number of possible edges) was greater than 95% of randomly sampled gene sets, indicating that the network is significantly more connected than random (p < 2.3E-03). In the network, node (gene) size is proportional to the number of connections. The color is assigned by community, defined as a gene set that is more connected to one another than to another group of genes. Results from this analysis are available in interactive form here: https://www.broadinstitute.org/genets#/computations/5a5d08f9a81b0d6eff609b4b.

