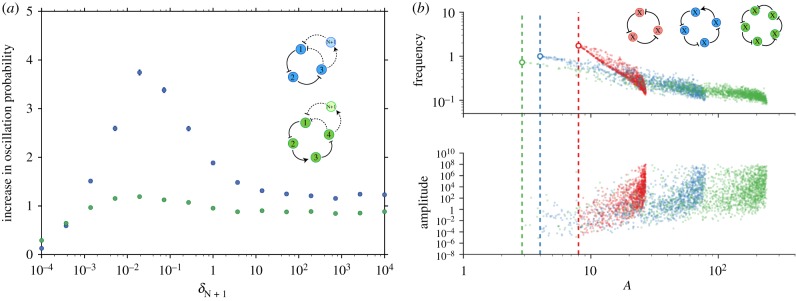
Figure 2.
Behaviour of N-gene oscillators. (a) Ratio of the probability of oscillations in an extended ring network with N + 1 genes and a genetic network of N genes for different values of the degradation rate of the N + 1th gene. In both cases explored N = 3 (blue) and N = 5 (green), the degradation of the N + 1th gene is varied while sampling the other degradation rates from the range δi = [10−3, 1] and keeping one random gene fixed at δ = 1. The other parameters and details of the sampling are the same as in figure 1c. (b) Frequency and amplitude of oscillations as a function of the network parameter A for 1000 successfully oscillatory networks from a random screening for different numbers of species with the same degradation rates δi = 1, N = 3 (red), N = 4 (blue) and N = 5 (green). Dashed lines and rings show the minimum critical value  and angular velocity at that point αm predicted by equations (2.13) and (2.14) for N = 3, 4, 5. The maximal values for A in the figure result from parameter sampling. In general Amax = (max ( Πi fi'(x*))), which can be arbitrarily large. The repression functions are the same as in figure 1c with parameters logarithmically sampled from the intervals ki : [10−5, 10−1], ai : [10−4, 108], ρRi : [10−4, 104], ρAi : [10−1, 1011], li : [101, 105].

