Figure 3.
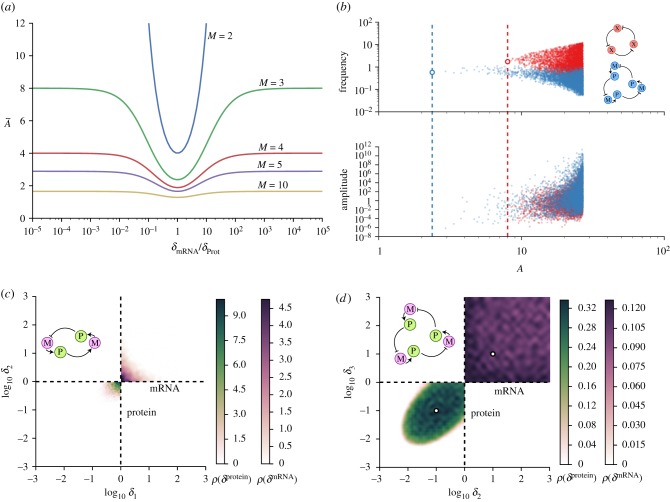
Effects of mRNA and protein degradation timescale differences. (a) Dependence of critical value of A on the ratio of the degradation rates of the protein and mRNA for a system composed of M genes with protein degradation rate δProt and mRNA degradation rate δmRNA. (b) Frequency and amplitude as a function of the network parameter A for 6000 successfully oscillatory networks from a random screening. The random screening was performed for the repressilator network simulated as direct repression between three genes (red) and as a six element network (blue) taking into account separately mRNA from protein dynamics. Dashed lines and rings show the minimum critical value  and angular velocity at that point αm predicted by equations (2.13) and (2.14) for N = 3 and N = 6. Repression functions and parameter screening were the same as in figure 2b with additional screening on the degradation rates δProt : [10−3, 1] and δmRNA : [1, 103], keeping one of the degradation rates fixed as δProt1 = 1. The translation of mRNA M into protein P is considered to be linear as fp(m) = apm, where ap was also logarithmically sampled (ap : [1, 108]). (c,d) Probability density of oscillations for the two (c)) and three (d)) gene network with mRNA (M = 2 and M = 3) for different sets of networks and degradation parameters. The degradation parameters of each test were sampled logarithmically from the ranges δmRNA = [1, 103] (upper quadrant) and δProt = [10−3, 1] (lower quadrant). Colours show the successfully oscillatory behaviour probability density of a network as a function of pairs of δmRNA and δProt. For the case M = 3, one of the species had fixed degradation rates given by δmRNA1 = 10 and δProt1 = 0.1 (white circles). The random sampling of the other parameters of the network was the same as in figure 2b.

