Figure 5.

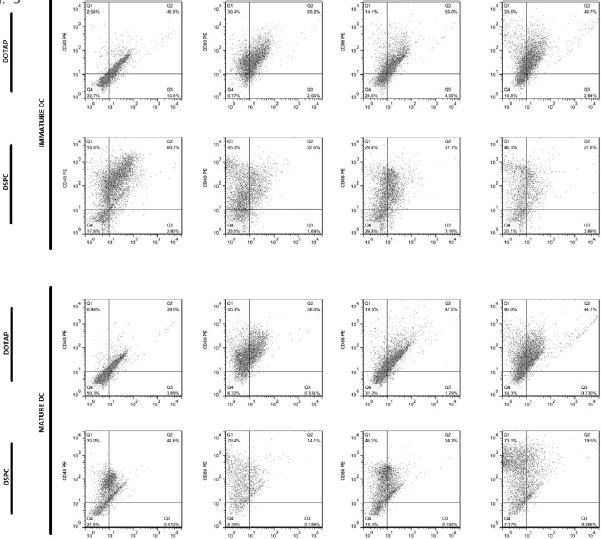
Dot plots showing flow cytometric analysis of cell surface marker’s expression on immature and mature BMDCs from C57BL/6 mice, after overnight incubation with liposomal forulations at 37 °C

Dot plots showing flow cytometric analysis of cell surface marker’s expression on immature and mature BMDCs from C57BL/6 mice, after overnight incubation with liposomal forulations at 37 °C