. 2018 May 3;32(3):461–472. doi: 10.21873/invivo.11262

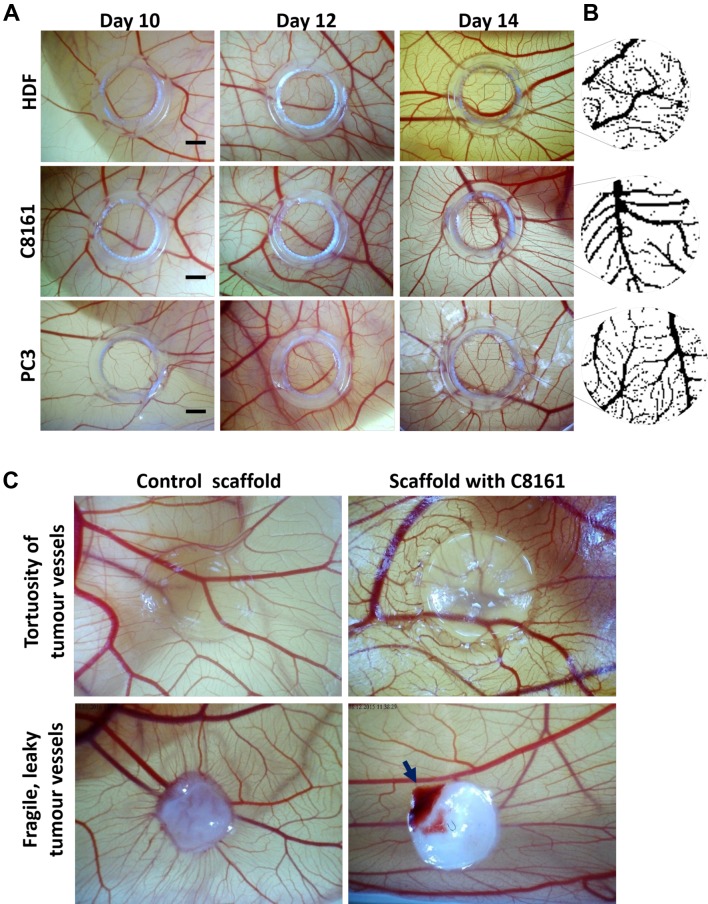
Figure 3. The gross appearance of tumour-induced angiogenesis on the area of implantation of the tumour cells/ fibroblasts on the chick chorioallantoic membrane (CAM). A) Micrographs of CAM regions at embryonic development days 10, 12 and 14 where human dermal fibroblasts (HDF) (upper row), melanoma (C8161) cells (middle row) and prostate cancer cells (PC-3) (lower row) were implanted. B) Processed images for each group at day 14 (quantification given in Table I). C) The quantification of images at B, the percentage area covered by blood vessels in each group at day 14. Scale bars represent 2 mm. C) The tortuosity of tumour blood vessels can be observed when tumour cells are encapsulated in a transparent hydrogel and implanted on CAM for 7 days. The fragility of blood vessels can be demonstrated as spontaneous bleeding (with movements of the chick embryo) when tumour cells seeded on an electrospun PLA scaffold were cultured on CAM for 14 days.

Figure 3