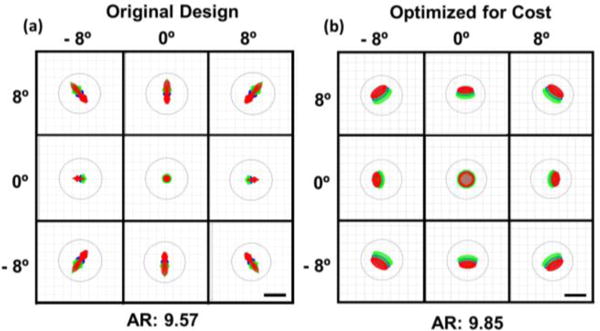
Fig 5.

Simulated optical performance at the retinal plane of a schematic eye before (a) and after (b) cost optimization of L2. The polychromatic geometric spots are shown for the extrema of the FOV The black circles show the Airy disk, and the Airy radii (AR) are in microns. Scale bars: 10 μm. Red: 1010 nm, green: 1100 nm, blue: 1060nm
