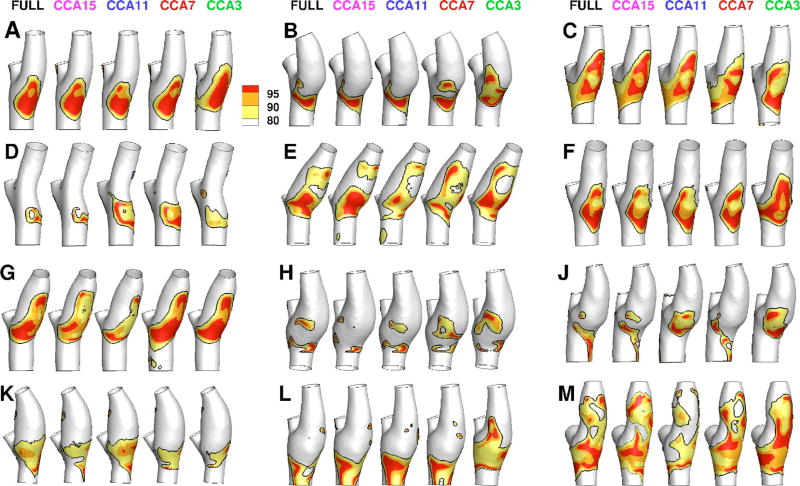
Fig. 2.
Color-coded distributions of RRT for all 12 participants for the various CCA lengths indicated at the top row. Black contour lines on each surface identify the area exposed to RRT above its 80th percentile value, as described in Sec. 2. Grayscales (colors online) indicate the areas exposed above the 80th, 90th, and 95th percentile values. Geometries are clipped at the CCA3, ICA5, and ECA2 locations used to bind the surface for disturbed flow calculations.

