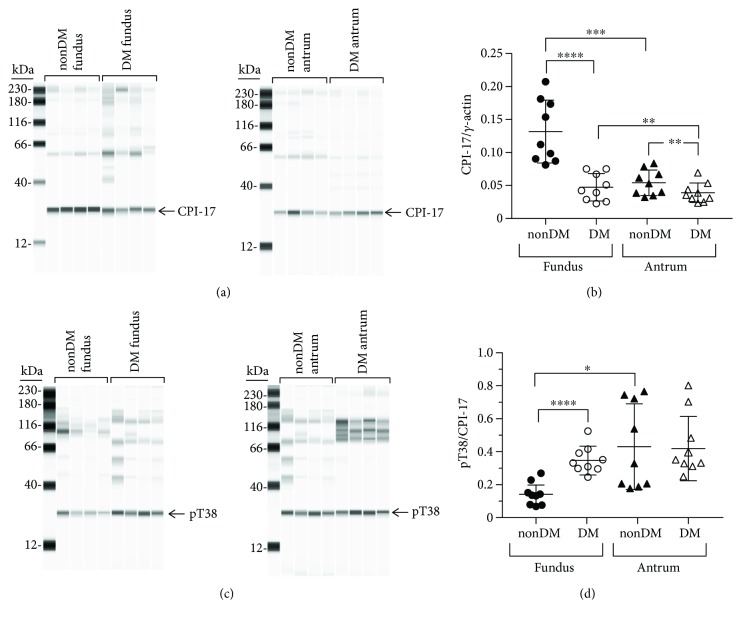
Figure 4.
CPI-17 expression and T38 phosphorylation in nondiabetic and diabetic gastric fundus and antrum smooth muscles. (a) Representative immunoblots of CPI-17 expression in nondiabetic and diabetic fundus (left panel, n = 4, each group) and nondiabetic and diabetic antrum muscles (right panel, n = 4, each group), 1 μg muscle lysate per lane. (b) CPI-17 expression relative to enteric γ-actin expression in nondiabetic and diabetic fundus and antrum smooth muscles. (c) Representative immunoblots of phosphorylated T38 in nondiabetic and diabetic fundus (left panel, n = 4, each group) and nondiabetic and diabetic antrum muscles (right panel, n = 4, each group), 1 μg muscle lysate per lane. (d) T38 phosphorylation relative to CPI-17 expression in nondiabetic and diabetic gastric fundus and gastric antrum smooth muscles. ∗P < 0.05, ∗∗P < 0.01, ∗∗∗P < 0.001, and ∗∗∗∗P < 0.0001.

