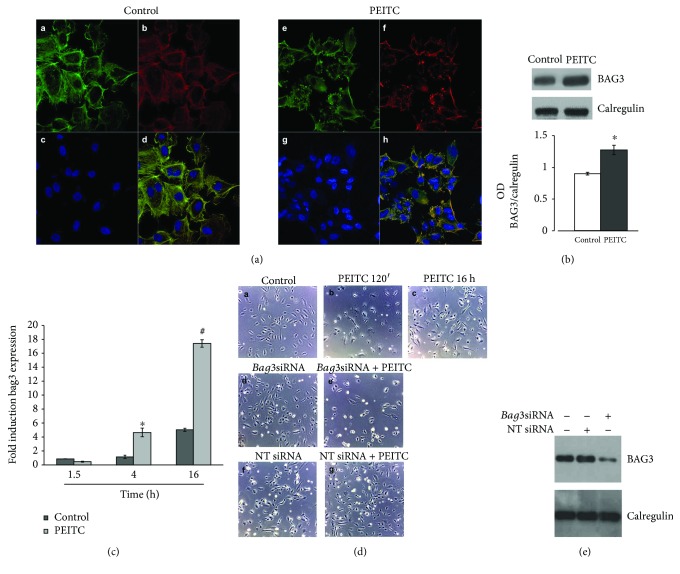
Figure 4.
PEITC treatment induces BAG3 expression and its delocalization in HUVECs. (a) Immunofluorescence analysis of HUVECs in control conditions and after PEITC treatment. Cells were stained with the BAG3 antibody (A–E), phalloidin (B–F) that allows for the visualization of F-actin, and Hoechst (C–G), and D–H are merged images. The merged image shows overlapping localization of BAG3 and F-actin. (b) HUVECs were treated with 0.01% DMSO (control) and with 10 μM PEITC for 16 h. Total protein extracts were analyzed by Western blot using the anti-BAG3 antibody and anti-calregulin antibody, as an internal loading control. The lower panel displays columns representing densitometric analysis of the data (expressed as the BAG3/calregulin ratio) corresponding to the upper panel (n = 2). ∗P < 0.05, statistically significant differences, were calculated by Student's t-test for unpaired data. (c) Analysis of bag3 mRNA levels by qRT-PCR. Fold induction of bag3 mRNA levels (y-axis) in HUVEC controls and PEITC-treated cells is expressed relative to β-actin mRNA levels. Data are the mean values ± SD from two independent experiments performed in triplicate. ∗P < 0.05 and #P < 0.01, statistically significant differences, compared to DMSO-treated cells (C), were calculated by one-way ANOVA with Dunnett's post hoc test using SigmaPlot12.0 software. (d) Phase-contrast images of HUVECs treated with (A) DMSO (control) at a final concentration (0.01%), with (B) PEITC (10 μM) for 120 min, and with (C) PEITC (10 μM) for 16 h. (D, E, F, G) HUVECs were transfected for 48 h with bag3 siRNA (100 nM) or with a NT siRNA (100 nM) and treated with (D, F) DMSO (control) at a final concentration (0.01%) and with (E, G) PEITC (10 μM) for 16 h. (e) HUVECs were transfected as described above. Total cell protein content was subjected to Western blot analysis to measure BAG3 levels and anti-calregulin antibody, as an internal loading control.

