
Fig. 1.
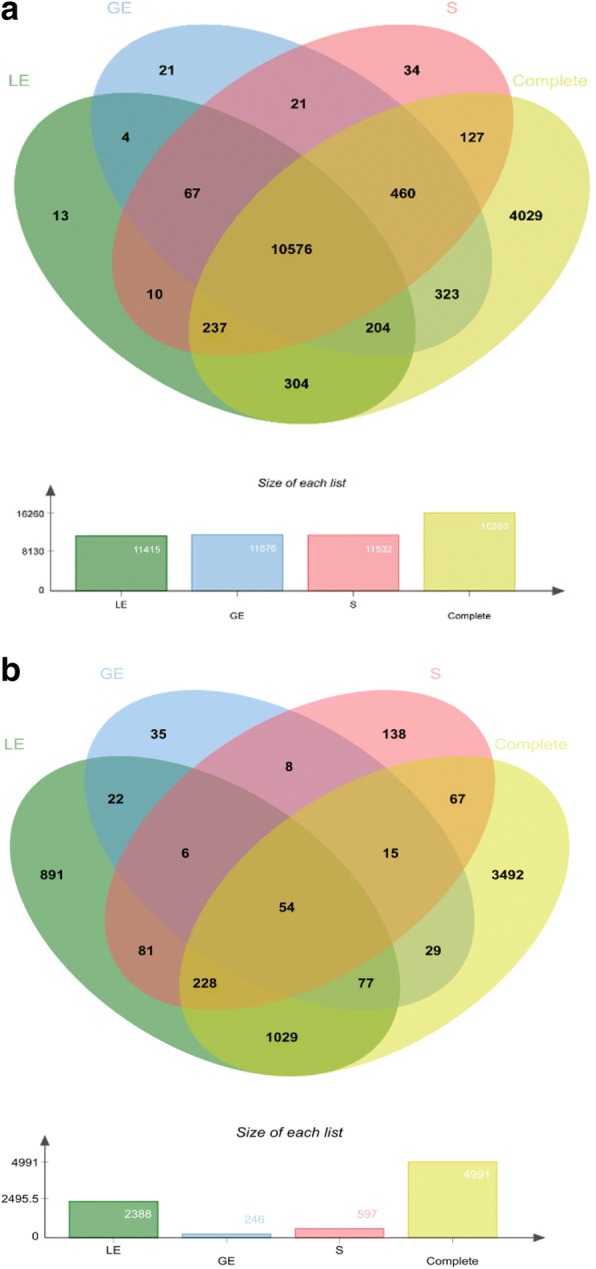
Venn diagram showing the overlaps of detectable genes (a) and differentially expressed genes (b). Green, luminal epithelium (LE); blue, glandular epithelium (GE); pink, stromal cells (S); yellow, complete tissue samples
Official websites use .gov
A
.gov website belongs to an official
government organization in the United States.
Secure .gov websites use HTTPS
A lock (
) or https:// means you've safely
connected to the .gov website. Share sensitive
information only on official, secure websites.
Venn diagram showing the overlaps of detectable genes (a) and differentially expressed genes (b). Green, luminal epithelium (LE); blue, glandular epithelium (GE); pink, stromal cells (S); yellow, complete tissue samples