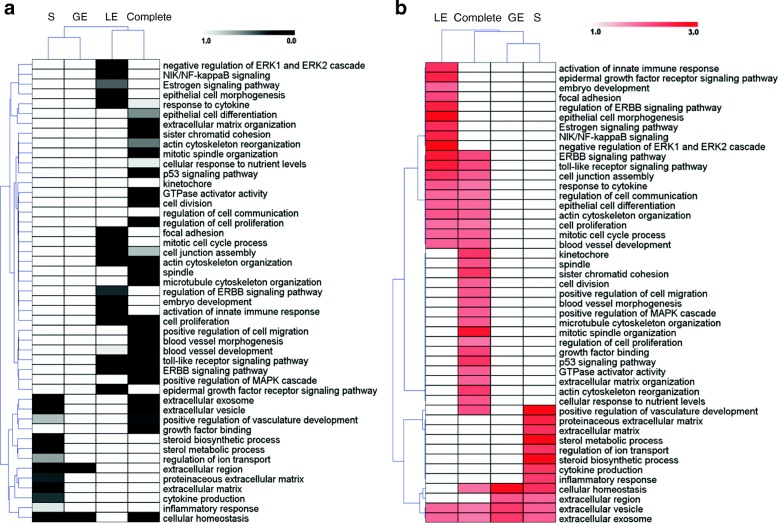
Fig. 4.
Comparison of significance of enrichment (false discovery rate, FDR) of selected functional categories and pathways between endometrial compartments and complete endometrium samples (a). Overrepresented functional categories and pathways were selected (FDR < 1%) from the results obtained for each cell type and the complete endometria. The FDR from 0 (black) to 1 (white) is shown for selected categories/pathways specific or in common for the studied cell types. Each row represents a function or pathway, each column a cell type or complete tissue (luminal epithelium (LE), glandular epithelium (GE), stromal cells (S), and complete tissue). Comparison of fold enrichment of selected functional categories and pathways between endometrial compartments and complete endometrium samples (b). Overrepresented functional categories and pathways were selected (FDR < 1%) from the results obtained for each cell type and the complete endometria. The fold enrichment from 1 (white, no enrichment) to 3 (red, 3-fold enrichment) is shown for selected categories/pathways specific or in common for the studied cell types. Each row represents a function or pathway, each column 1 cell type or complete tissue (luminal epithelium (LE), glandular epithelium (GE), stromal cells (S), and complete tissue)

