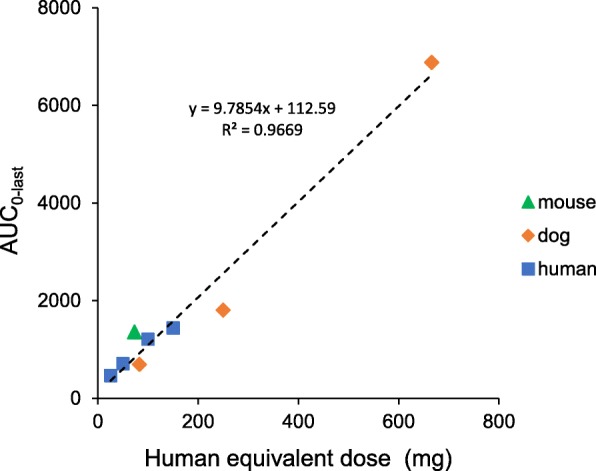
Fig. 4.

The relationship between a single pixatimod dose and exposure (AUC) across mouse, dog and human. The Week 1 AUC0-last data from Table 1 are plotted as a function of the human equivalent dose (HED). The dotted line represents a linear regression of all of the data yielding an R2 of 0.9669 and a y intercept of 112.59
