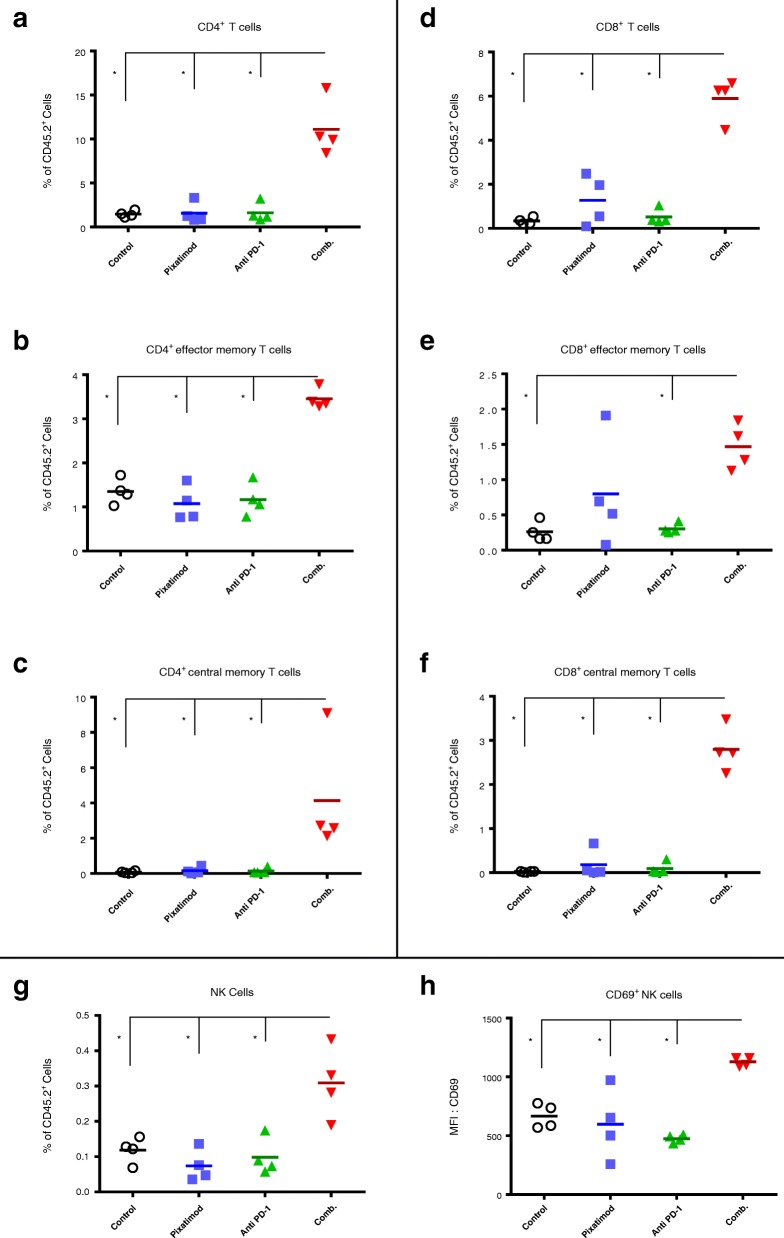
Fig. 7.
Phenotype analysis of immune cells in the tumors of the 4T1.2 breast cancer model (Fig. 6). Immune cells were isolated from the tumors of mice in the satellite groups (day 11) and phenotyped by flow cytometry. a Total CD4+ T cells (b) effector memory CD4+ T cells and (c) central memory CD4+ T cells. d Total CD8+ T cells (e) effector memory CD8+ T cells and (f) central memory CD8+ T cells. g Total and (h) CD69+ NK cells. Treatment averages indicated with short solid horizontal lines. *P < 0.05 versus control

