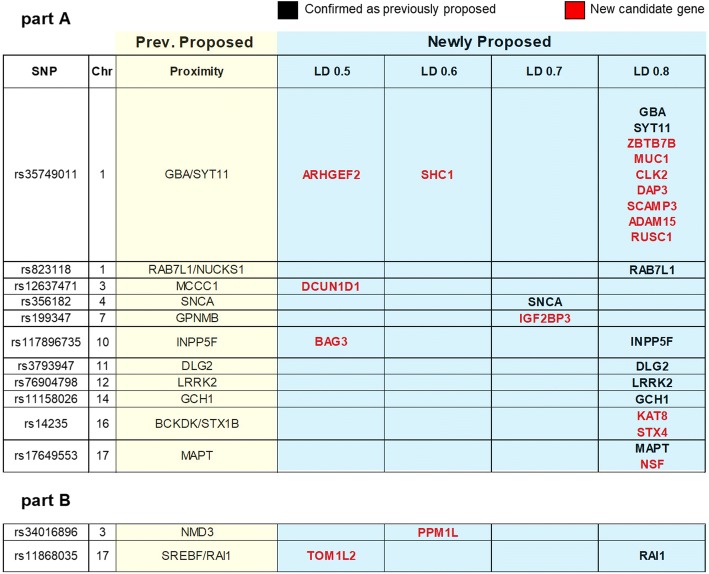
Fig. 3.
PD-GWAS gene prioritization. Significant SNPs from PD-GWAS and ORFs in LD (from r2 > 0.5 to r2 > 0.8) are shown. Part A contains significant SNPs as per joint analysis; part B contains significant SNPs as per discovery phase. The candidate genes based on proximity are summarized in the column with light yellow background. Newly proposed candidate genes identified on the basis of our analysis of the functionally relevant proteins in the PPI network are summarized in the column with light blue background. Here genes in black font confirm previous assignments by proximity, whilst genes in red font are the novel candidate genes for sporadic PD

