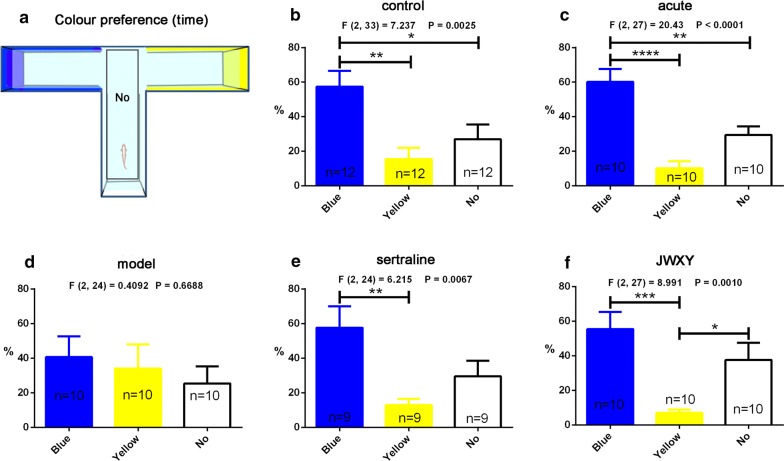
Fig. 6.
Colour preference profiles of zebrafish exposed to sertraline and JWXY capsule after reserpine treatment in the T-maze test. a Diagram of the T-maze and distribution of colours. The centre of the T-maze was denoted as No, and zebrafish started in that location. b The duration (time) of WT zebrafish in every colour arm. c The duration (time) of zebrafish treated with reserpine for approximately 20 min (acute) in every colour arm. d The duration (time) of zebrafish exposed to system water (model) after reserpine treatment in every colour arm. e The duration (time) of zebrafish exposed to sertraline after reserpine treatment in every colour arm. f The duration (time) of zebrafish exposed to JWXY capsule after reserpine treatment in every colour arm. Control: untreated AB strain zebrafish. Acute: acute treatment with reserpine for 20 min. Model: after acute treatment of reserpine, zebrafish were exposed to system water for 7 days to generate the depression model. Sertraline: after acute treatment with reserpine, zebrafish were exposed to sertraline for 7 days. JWXY: after acute treatment with reserpine, zebrafish were exposed to JWXY capsule for 7 days. The data are expressed as the mean ± S.E.M. and were analysed by one-way ANOVA followed by the Tukey post hoc test. Significance was defined as *p < 0.05, **p < 0.01, ***p < 0.001 and ****p < 0.0001

