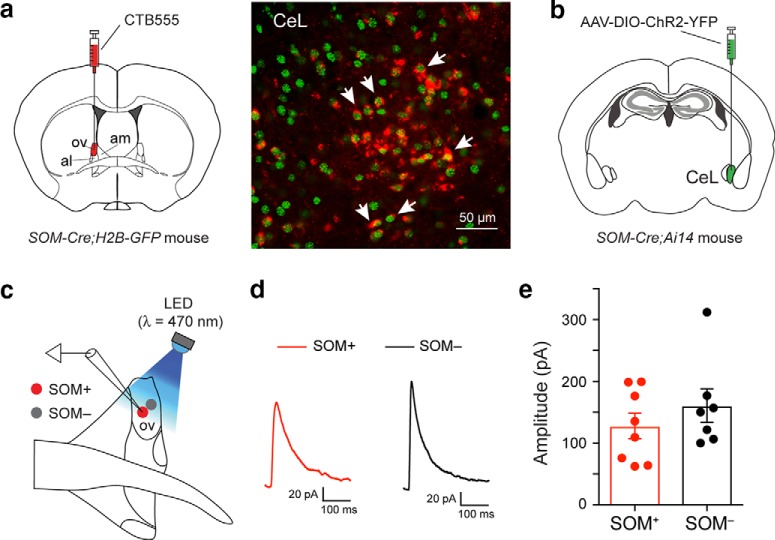
Figure 5.
SOM+ CeL neurons innervate neurons in the ovBNST. a, Left, A schematic of the experimental approach. Right, CTB-labeled neurons can be detected in the CeL (red), many of which are SOM+ (green; arrows). CTB, Cholera Toxin subunit B. b, A schematic of the experimental approach. c, A schematic of the recording configuration. d, Example traces of the IPSCs recorded from a SOM+ (red) and a SOM− (black) ovBNST neuron in response to optogenetic stimulation of the inputs from SOM+ CeL neurons. e, Quantification of IPSC amplitude. Data are presented as the mean ± SEM in e.

