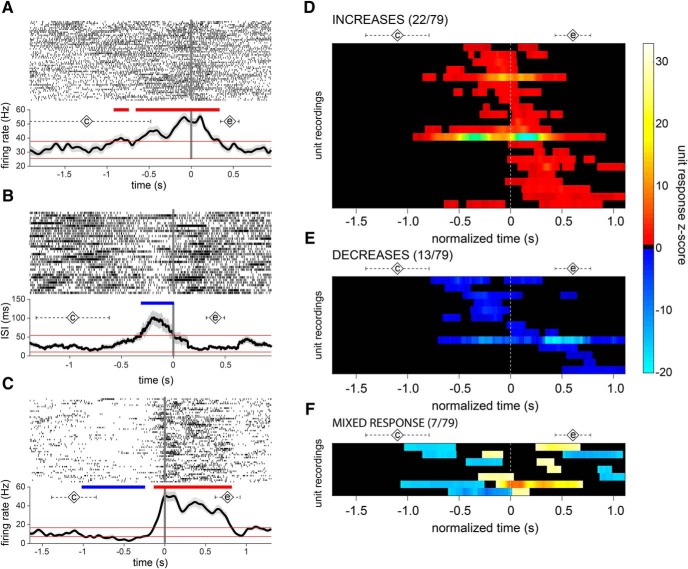
Figure 3.
STN neuronal firing is modulated during speech. Examples of A-sort single-unit neuronal responses during speech showing (A) increases, (B) decreases, and (C) mixed responses in firing rate, aligned to production onset (t = 0). Spike rasters across trials are shown in A–C, top, and mean firing rate (A, C) or mean ISI (B) are shown on the bottom. Diamonds labeled with a “c” indicate mean time of cue presentation; diamonds labeled with an “e” indicate mean speech end; dashed error bars indicate the corresponding SDs. D–F, Raster plots illustrating the timing of firing rate responses across the population of unit recordings. Each row represents a unit's significant changes relative to baseline, during a time segment surrounding production onset. The time scale is normalized across units from 0.5 s before the mean cue onset until 0.5 s after the mean end of speech.

