Figure 10.
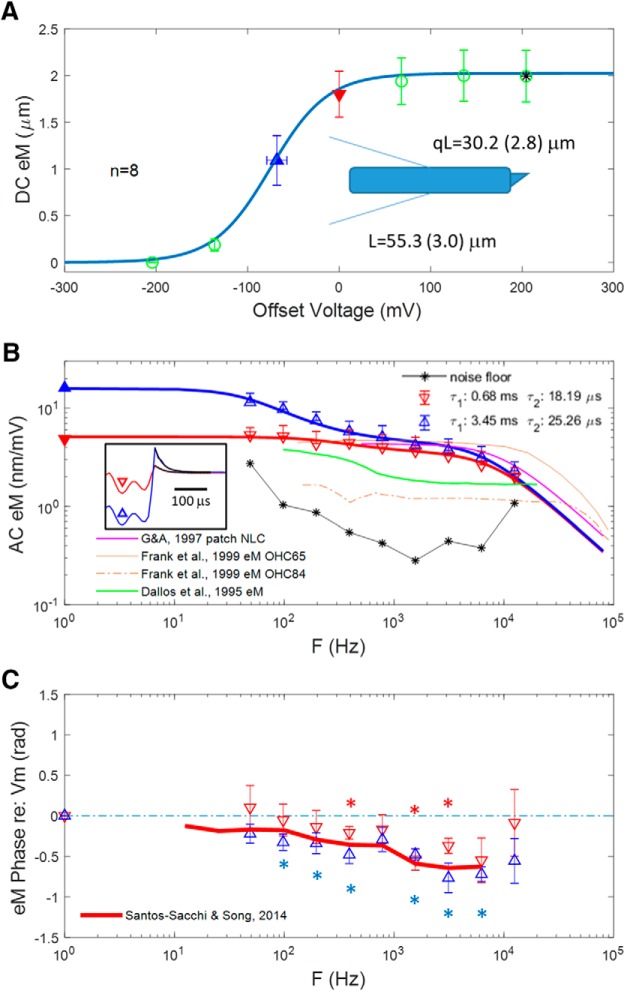
eM evoked with the microChamber wide-band stimulus delivery system and video captured at 50,000 fps. No frame averaging. Two components are evident, whose frequency response is dependent on offset from Vh. A, DC eM magnitude versus offset voltage. Cells were partitioned near midway along cell length (schematic), with average length (L) being 55.3 ± 3.0 μm, and the average portion outside the chamber (qL) being 30.2 ± 2.8 μm. The Boltzmann fit provides a z parameter of 0.83, in good agreement with our estimates from NLC and Qp. Our eM gain of 16.8 nm/mV is typical of reported whole-cell responses. In the absence of a voltage offset, stimulation is substantially removed from Vh, the location of maximal gain. B, Magnitude–frequency plot of average eM from two regions of the DC plot (denoted by solid triangles). DC average gains derived from A are replotted on left gain (nm/mV) axis. The boxed inset shows the current relaxations after return to zero voltage (red and blue), fit with a single exponential (black lines), and used to correct for voltage frequency roll-off. Clamp τ at zero offset: 25.8 μs; near Vh: 23.96 μs. Colors and symbols correspond to offsets and match those of the model of Figure 9C–E. See text for more details. Responses obtained from an offset close to Vh (upward blue triangles) show a large low-pass component, whereas responses without an offset (downward red triangles) show a reduced low-pass component. Each has faster components away from Vh. Thin, black asterisk line is noise floor estimated from +200 mV offset in A, where AC responses are saturated. For comparison, magenta lines depict patch NLC from Gale and Ashmore. Brown lines show microchamber eM gain functions for two cells from Frank et al. Green line from Dallos et al. shows microchamber eM gain derived from their reported excitation voltage of ±0.6 mV. Clearly, these eM data were collected at offset from Vh. See text for discussion. C, eM phase shows differences depending on voltage offset that may be due to differing eM gain. While a clear frequency-dependent lag relative to voltage occurs near Vh, it is less clear for responses away from Vh. Statistical significance (p < 0.05) from zero is indicated by correspondingly colored asterisks. The red line depicts the eM phase lag found by us previously under whole-cell conditions (Santos-Sacchi and Song, 2014). AC voltage stimulation at each frequency was ∼14 mV (see Materials and Methods).

