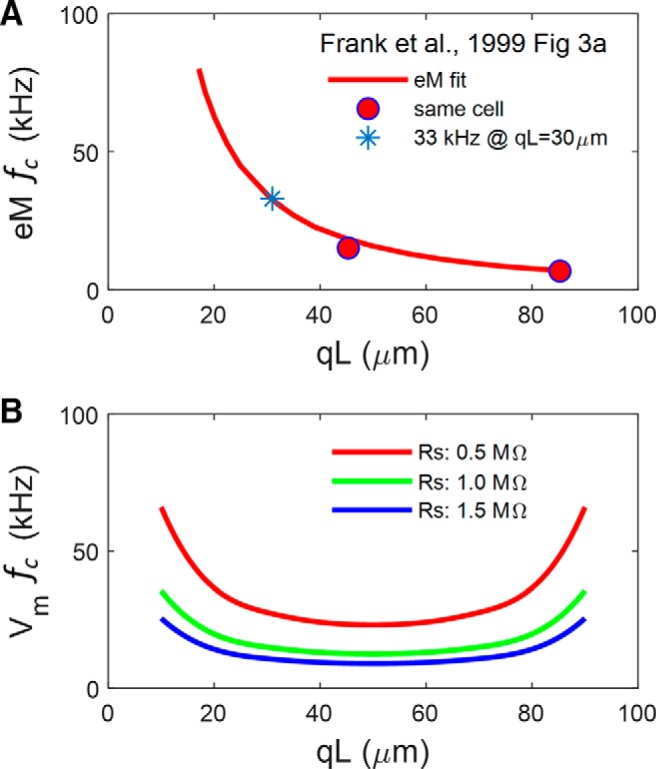
Figure 11.

Apparent disparity between microchamber voltage and eM. A, Fit of eM fc for 57 cells from Frank et al. Figure 3A, and response of same cell with differing cell extrusion, qL. Asterisk denotes fc at a qL similar to our present average. B, Vm cutoffs for a cell model possessing NLC (capacitor with 2-state Boltzmann characteristics), indicating marked dependence of fc on Rs. Cell parameters are Clin: 22 pF; Rm: 300 MΩ; Rs: 0.5 (red), 1.0 (green), or 1.5 (blue) MΩ; Rsh: 5 MΩ; NLC parameters are z: 0.85; Qmax: 3.8 pC; Vh: 0 mV. fc is a U-shaped function of qL.
