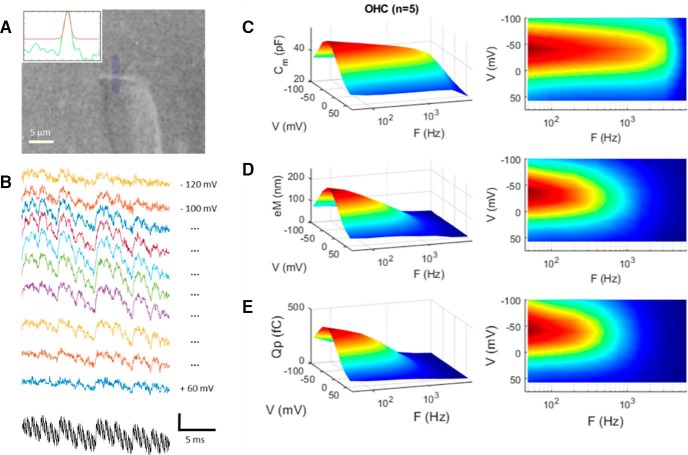
Figure 2.
Low-pass electromechanical behavior of the OHC under whole-cell voltage clamp. A, Video frame of an OHC whose eM was measured by tracking the edge of its cuticular plate. Inset, Bright edge (green line) is fitted with a Gaussian (red line) and tracked across frames (25,000 fps). B, Raw eM responses (colored traces) generated by the multifrequency voltage stimulus (black trace) summed to differing holding potentials. eM responses are arbitrarily offset and colored for easy visualization. Vertical scale bar is 0.45 μm for eM and 50 mV for voltage (sum of 9 15 mV peak harmonic frequencies starting at 48.8 Hz). C, NLC, in contrast to linear capacitance, is frequency dependent, showing low-pass behavior. Rightmost panels show alternative view of surface plots to appreciate frequency response. D, eM shows lower-pass behavior compared with NLC. E, Prestin sensor charge (Qp) shows behavior similar to eM. eM and Qp frequency-response time constants at Vh are statistically indistinguishable by t test (p = 0.134). Average responses from five cells.

