Figure 3.

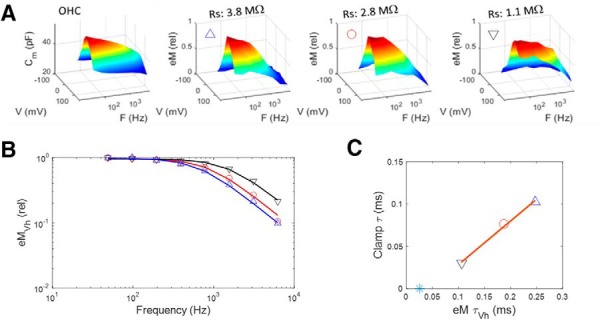
Whole-cell clamp time constant limits eM frequency response. A, Left panel shows NLC in an OHC, whose eM was measured at three different values of Rs (achieved through amplifier Rs compensation circuitry). As clamp time constant is decrementally reduced (clamp τ ≈ Rs * Cm), eM frequency response approaches that of NLC. Symbols correspond for all plots. B, Magnitude–frequency plot illustrating enhanced frequency response of eM at Vh. C, Linear relationship between eM and clamp time constants. eM τVh approaches this cell's NLC τVh, determined from a single exponential fit (blue asterisk). Stimulus was 15 mV peak at each frequency.
