Figure 5.
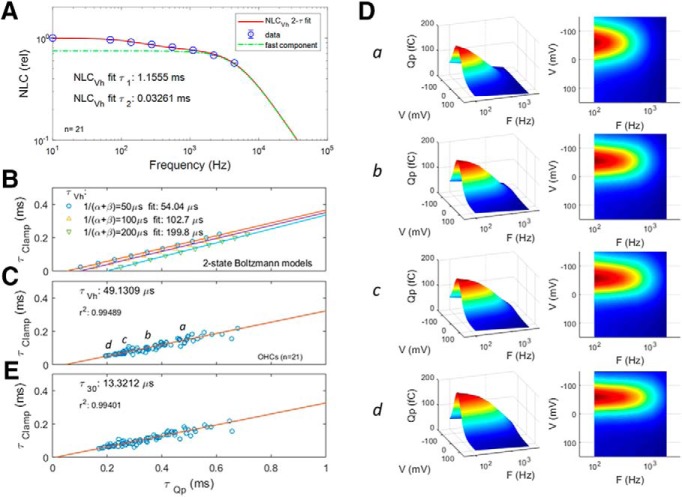
NLC has two frequency components whose kinetics limits Qp frequency response. Average responses from 21 cells. A, Magnitude–frequency plot of average NLC at Vh. A dual-Lorentzian fit reveals slow and fast components (A1: 0.2453; τ1: 1.12 ms; A2: 0.7469; τ2: 32.6 μs). NLC is plotted relative to values at lowest frequency, which is NLC determined from step-induced (DC) transients (Huang and Santos-Sacchi, 1993) during changes in command holding potential. Error bars indicate SE. Dotted green line is plot of faster component. B, Relationship between clamp τ and Qp τ for three two-state models of differing rate constants, illustrating that regressions to zero clamp τ can identify each model's characteristic time constant. C, Similarly, regressions on OHC Qp provide a limiting time constant approaching the fast τ component of NLC. D, a–d, Five cell-binned averages computed and plotted, illustrating the enhanced frequency response as clamp τ decreases (a: 153.0 ± 1.75 μs; b: 100.9 ± 1.2 μs; c: 70.9 ± 1.4 μs; d: 55.7 ± 1.9 μs. Qp Lorentzian fits data and model are from 100 to 3200 Hz. E, Plot of Qp at an offset voltage of 30 mV from Vh, showing that τQp decreases at voltages away from Vh (with gain–bandwidth tradeoffs). Five millivolt peak AC stimulation. See text for Boltzmann mean (SE).

