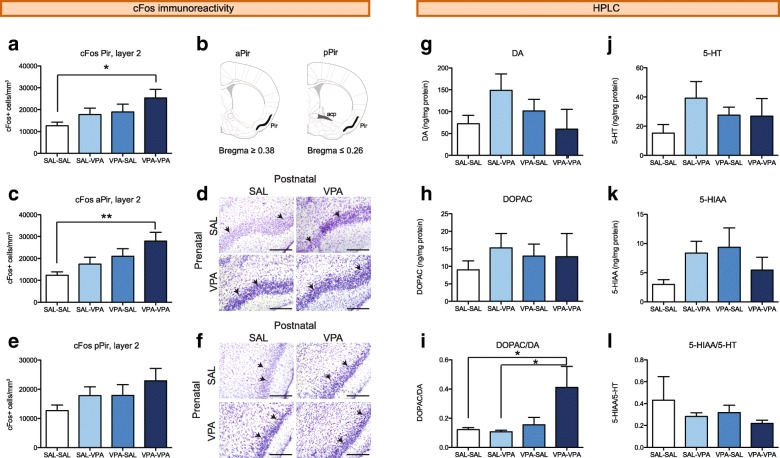
Fig. 5.
VPA-VPA mice show increased c-Fos immunoreactivity and dopaminergic turnover in the piriform cortex. a–f Density of c-Fos-positive nuclei was measured in the whole Pir (a). Schemes in b show the posterior limit of the aPir and the anterior limit of the pPir, where the posterior part of the anterior commissure (acp, dark gray) is visible. Data is also presented discriminating between the anterior part of the Pir (c, aPir) and the posterior part of the Pir (e, pPir). n = 5–7 mice/group. Representative images of the aPir (d) and pPir (f) for the four experimental groups are shown. c-Fos-positive nuclei (black, arrows show examples) in Nissl stained slices. Bars, 200 μm. g–l Monoamine levels in the Pir were measured by HPLC-ED. g DA, h DOPAC, i DA turnover (DOPAC/DA), j 5-HT, k 5-HIAA, and l 5-HT turnover (5-HIAA/5-HT). n = 4–5 mice/group. Two-way ANOVA followed by Tukey’s post hoc tests, *p < 0.05, **p < 0.01. Graphs indicate means + s.e.m. Detailed statistical information is available in Additional file 1: Table S3

