Figure 2.
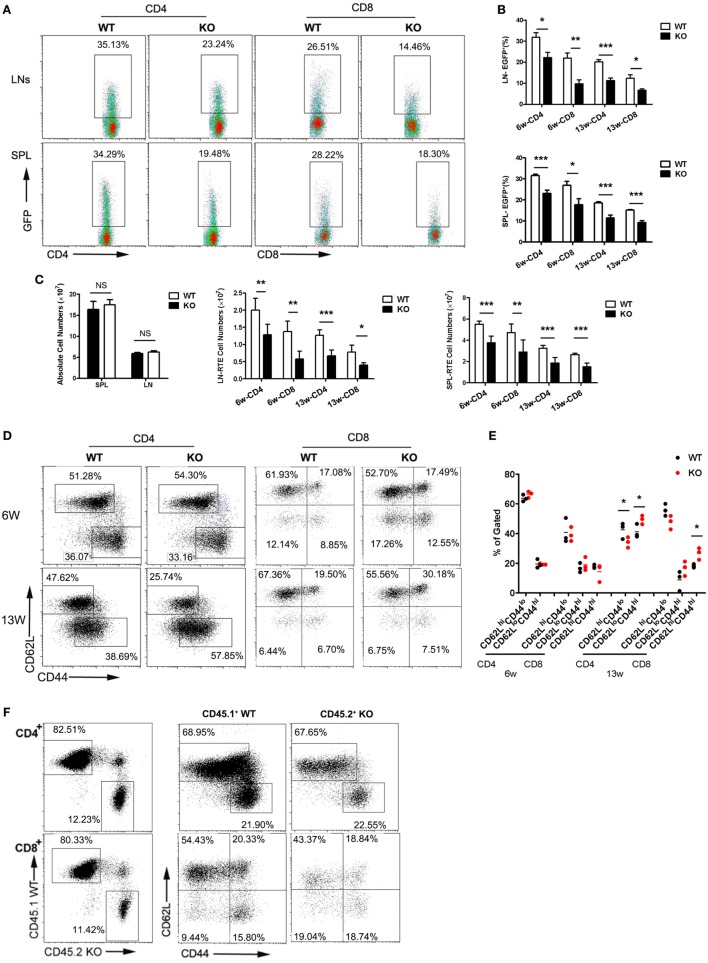
Reduced thymic output and lymphopenia-induced homeostatic expansion of peripheral T cells in Ccr2−/− mice. Single cell suspensions were prepared from the lymph node (LN) and spleen (SPL) of wild-type (WT) and Ccr2 knockout (KO) mice at 6 and 13 weeks of age and analyzed by flow cytometry. (A) Representative dot plots showing EGFP+ RTEs in CD4+ and CD8+ T cells from 6-week-old mice. (B) The percentage of RTEs in the peripheral CD4+ and CD8+ T cells in 6- and 13-week-old mice. Data are presented as mean ± SD with at least 10 mice for each group. (C) The absolute numbers of total and CD4+ and CD8+ RTEs in the SPL and LNs (axillary + inguinal + mesentery). (D) CD62L and CD44 staining for splenic CD4+ and CD8+ T cells in 6- and 13-week-old mice. The slight different gating for cells at different ages were based on the appearance of distinct populations under specific instrument settings. (E) Percentage of the CD62LhiCD44lo (naive), CD62LloCD44hi (activated), and CD62LhiCD44hi (memory) cells among CD4+ and CD8+ T cells. Data are presented as mean ± SEM with at least nine mice for each group. (F) Lethally irradiated mice were reconstituted with CD45.1+ WT and CD45.2+ KO bone marrow cells mixed at a ratio of 4:1. CD62L and CD44 expression by splenic CD4+ and CD8+ T cells were analyzed by gating on the CD45.1+ or CD45.2+ population in the recipient mice. Representative dot plots are shown out of two independent experiments with a total of nine mice. Statistical differences were determined by the Student’s t test. *p < 0.05, **p < 0.01, ***p < 0.001.

