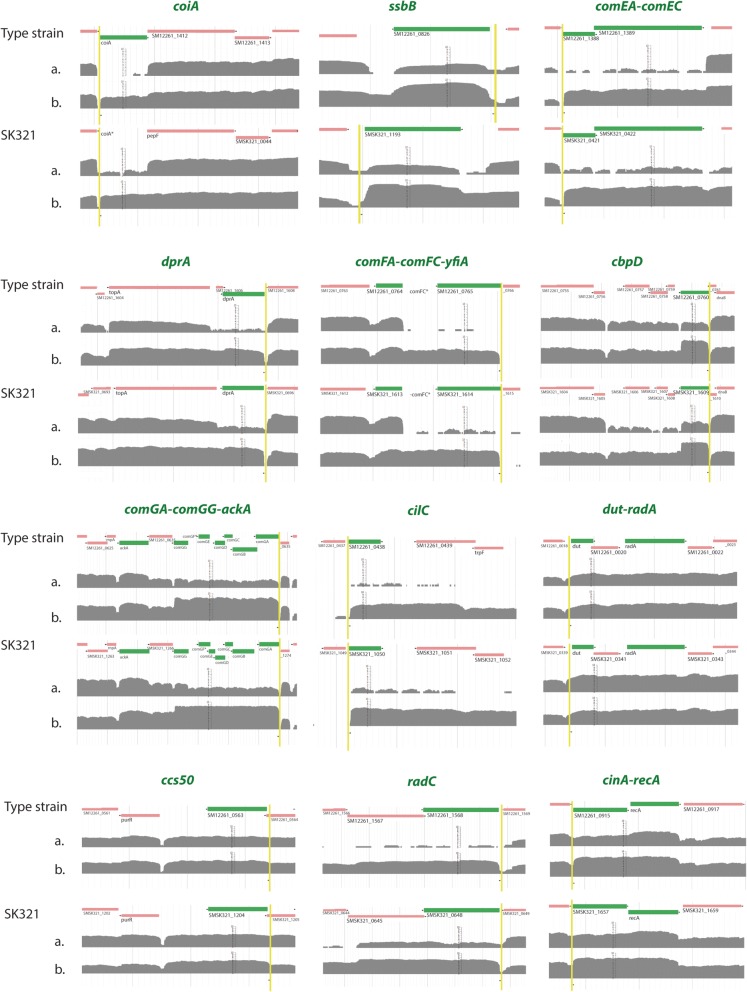
Fig. 4.
Similarity of transcriptome profiles in the transcriptional initiation regions of SigX regulon core genes [29] in the type strain and SK321. The SigX core genes are marked in green. The arrows highlighted in yellow show the region where sequences matching the SigX-box consensus were found. Line a. corresponds to the control culture and line b. to the culture treated with CSP. Comparison between lines a. and b. shows the higher expression found in samples treated with the pheromone. Stars followed by gene annotation represent non-annotated sequences in S. mitis genomes

