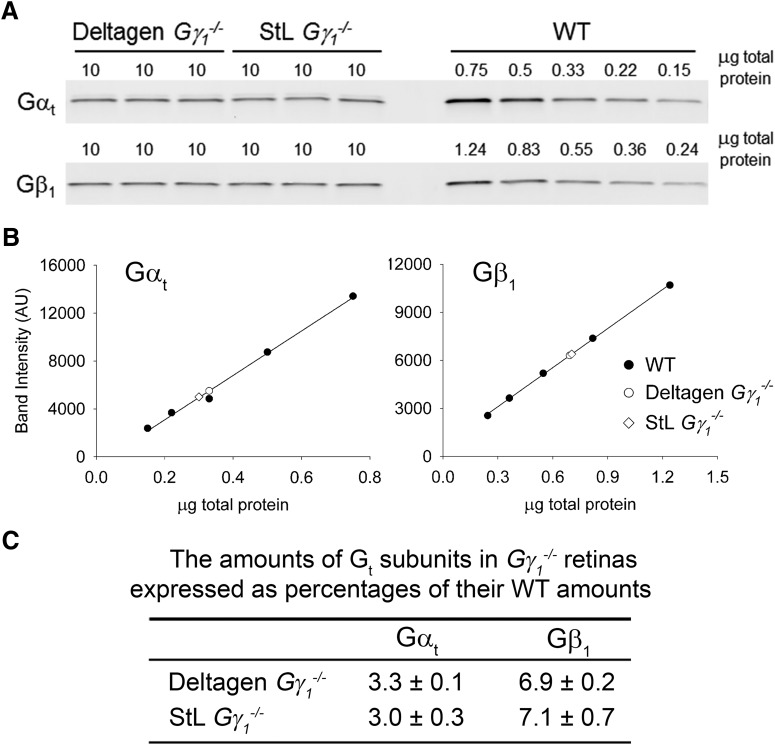
Figure 1.
Comparative analysis of Gαt and Gβ1 expression levels in retinal lysates from 1-month-old Gγ1−/− mice. A, Retinal lysates from Deltagen and StL mouse strains containing 10 μg of total protein were separated by SDS-PAGE alongside serial dilutions of WT retinal lysates and were immunoblotted with antibodies against each transducin subunit. Data are taken from one of three similar experiments. B, The relative contents of Gαt and Gβ1 in retinal lysates analyzed in A were determined from the calibration curves obtained from the WT lysate dilutions (Gαt regression equation: y = 18,600 × x − 623; Gβ1 regression equation: y = 8130 × x + 665). • = WT, ○ = Deltagen Gγ1−/−, and ♢ = StL Gγ1−/−. C, The amounts of transducin subunits in Gγ1−/− retinas averaged across three independent experiments are expressed as percentages of their amounts in WT retinas (mean ± SD). The amount of Gβ1 was corrected to reflect that only 18% of Gβ1 in Gγ1−/− retinas is expressed in rods, whereas the rest is expressed in the inner retina (Lobanova et al., 2008).

