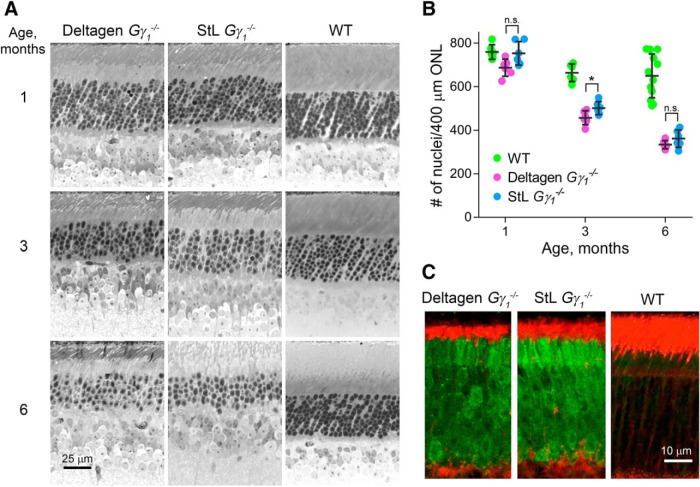
Figure 3.
Comparative analysis of retinal morphology in Deltagen and StL Gγ1−/− mice. A, Representative images of toluidine blue-stained, plastic-embedded 1-μm-thick retinal cross sections from each mouse strain at the indicated ages. Scale bar, 25 μm. B, The number of photoreceptor nuclei counted in 400 μm outer nuclear layer (ONL) segments located 1 mm from either side of the optic nerve. The number of nuclei in each segment was counted by hand. Data were averaged across nuclear counts obtained from each side of the optic nerve from three or four animals of each age and genotype, and are shown as the mean ± SD. Each dot represents a single data point. C, Accumulation of the UbG76V–GFP reporter of proteasomal activity (green) in rods of 3-month-old Deltagen and StL Gγ1−/− mice. A UbG76V–GFP-expressing WT retina is shown as a control. Wheat germ agglutinin staining is shown in red. Scale bar, 10 μm.

