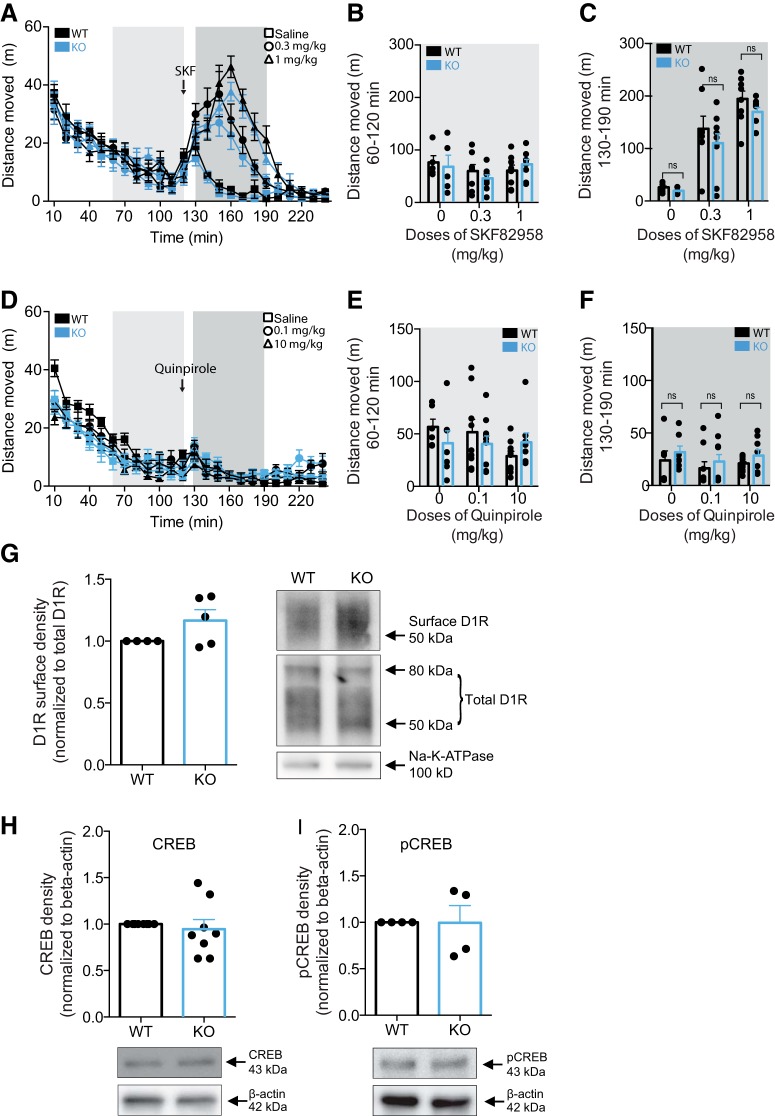
Figure 3.
Preserved postsynaptic DA D1R signaling in PICK1 KO mice. A–C, Mice were placed in open field boxes and left to habituate for 120 min before being injected with the indicated doses of SKF82958. Locomotor activity (distance moved in m) was recorded for 2 h after drug injection. Analysis of the 60 min before and after drug injection reveals a treatment effect, with no genotype difference on genotype response (FGENOTYPE = 1.58, df = 1, p = 0.22, FTREATMENT = 21.15, p < 0.0001, df = 2, FGENOTYPE*TREATMENT = 0.29, p = 0.75, df = 2). B, Locomotor activity of the last 60 min before drug injection. C, Locomotor activity of the first 60 min after drug injection. D–F, Mice were placed in open field boxes and left to habituate for 120 min before being injected with the indicated doses of quinpirole. Locomotor activity (distance moved in m) was recorded for 2 h after drug injection. Analysis of the 60 min before and after drug injection reveals no genotype difference on the behavioral effects of quinpirole (FGENOTYPE = 0.06, df = 1, p = 0.81, FTREATMENT = 0.83, p = 0.44, df = 2, FGENOTYPE*TREATMENT = 0.83, p = 0.45, df = 2). E, Locomotor activity of the last 60 min before drug injection. F, Locomotor activity of the first 60 min after drug injection. G, Immunoblotting of striatal lysates demonstrates that surface levels of D1R is unchanged in PICK1 KO mice (t(4) = 1.91, p = 0.13). Left panel, Densitometric analysis of immunoblot for wild-type and PICK1 KO mice. Right panel, Representative immunoblot for D1R and Na-K-ATPase in wild-type and PICK1 KO mice. H, I, Immunoblotting of striatal lysates show unaltered expression levels of CREB and pCREB in PICK1 KO mice compared to wild-type controls (CREB: t(7) = 0.53, p = 0.61, pCREB: t(3) = 0.03, p = 0.98). Upper panels, Densitometric analysis of immunoblots for CREB and pCREB in wild-type and PICK1 KO mice. Lower panels, Representative immunoblots for pCREB and β-actin in wild-type and PICK1 KO mice. All data expressed as mean ± SEM.

