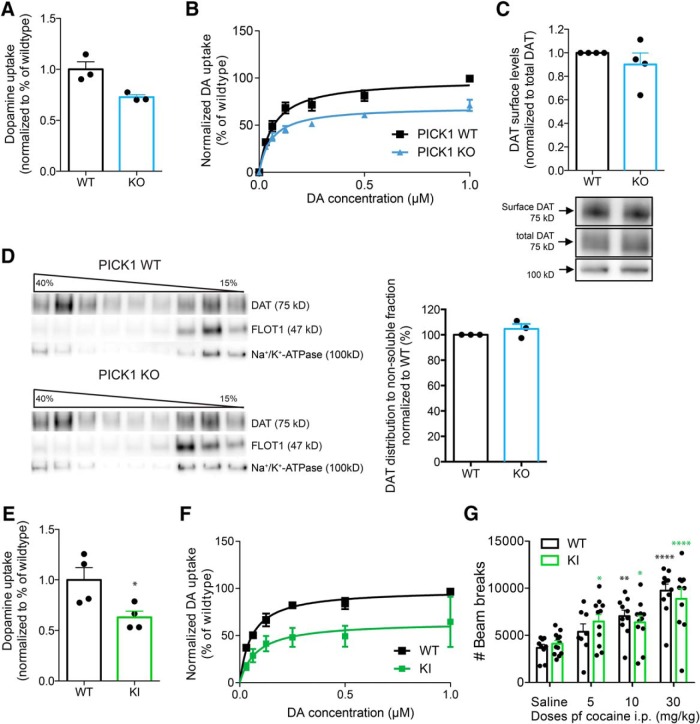
Figure 4.
PICK1 KO mice show unaltered cellular distribution of DAT but reduced striatal DA uptake. DAT + Ala knock-in mice with a disrupted PDZ-binding motif demonstrate similar loss of DA uptake, albeit preserved locomotor response to cocaine. A, B, DA uptake in striatal synaptosomes from PICK1 KO mice and wild-type controls. Reduced DA uptake in striatal preparations from PICK1 KO mice (Vmax 72.7 ± 24% of wild type; t = 3.48, p = 0.03, df = 4; A). B, Normalized saturation curve for DA uptake in striatal synaptosomes from PICK KO mice and wild-type littermate controls (maximal uptake capacity Vmax: wild type = 57.6 ± 4.3 fmol/min/μg; KO = 41.9 ± 1.4 fmol/min/μg, mean ± SEM). C, Surface biotinylation of striatal slices demonstrate that PICK1 KO mice have preserved surface-expressed DAT compared to wild-type (t(3) = 1.01, p = 0.39). Left panel, Densitometric analysis of immunoblots from wild-type and PICK1 KO mice. Right panel, Representative immunoblots for DAT and Na-K-ATPase. D, Sucrose gradient centrifugation using striatal preparations show unaltered membrane distribution between the fractions with high and low buoyancy in PICK1 KO mice when compared to wild type. Left panel, Western blotting of a representative sucrose gradient fractionation from striatal lysates in a gradient from 15% to 40% and immunoblots for DAT, flottilin-1 (a marker of membrane rafts), and Na-K-ATPase. Right panel, Densitometric analysis showing the fraction of DAT distribution to nonsoluble (high buoyancy) fractions compared to wild-type controls (t(2) = 1.18, p = 0.36). E, DA uptake in striatal synaptosomes from DAT + Ala mice and wild-type controls. Reduced DA uptake in striatal preparations from DAT + Ala (Vmax 63 ± 6% of wild type, t = 2.74, p = 0.03). F, Normalized saturation curve for DA uptake in striatal synaptosomes from DAT + Ala mice and wild-type littermate controls (maximal uptake capacity Vmax: wild type = 49.87 ± 6.0 fmol/min/μg; KO = 31.36 ± 3.1 fmol/min/μg, mean ± SEM). G, Assessment of cocaine-induced locomotor hyperactivity shows no genotype difference (FINTERACTION(3,74) = 0.84, p = 0.48, FTREATMENT(3,74) = 20.31, p < 0.0001, FGENOTYPE(1,74) = 4.810e-005, p = 0.99). Black and green bars represent wild-type and corresponding DAT + Ala mice. There was no treatment difference between treatment groups. All data expressed as mean ± SEM.

