Figure 6.
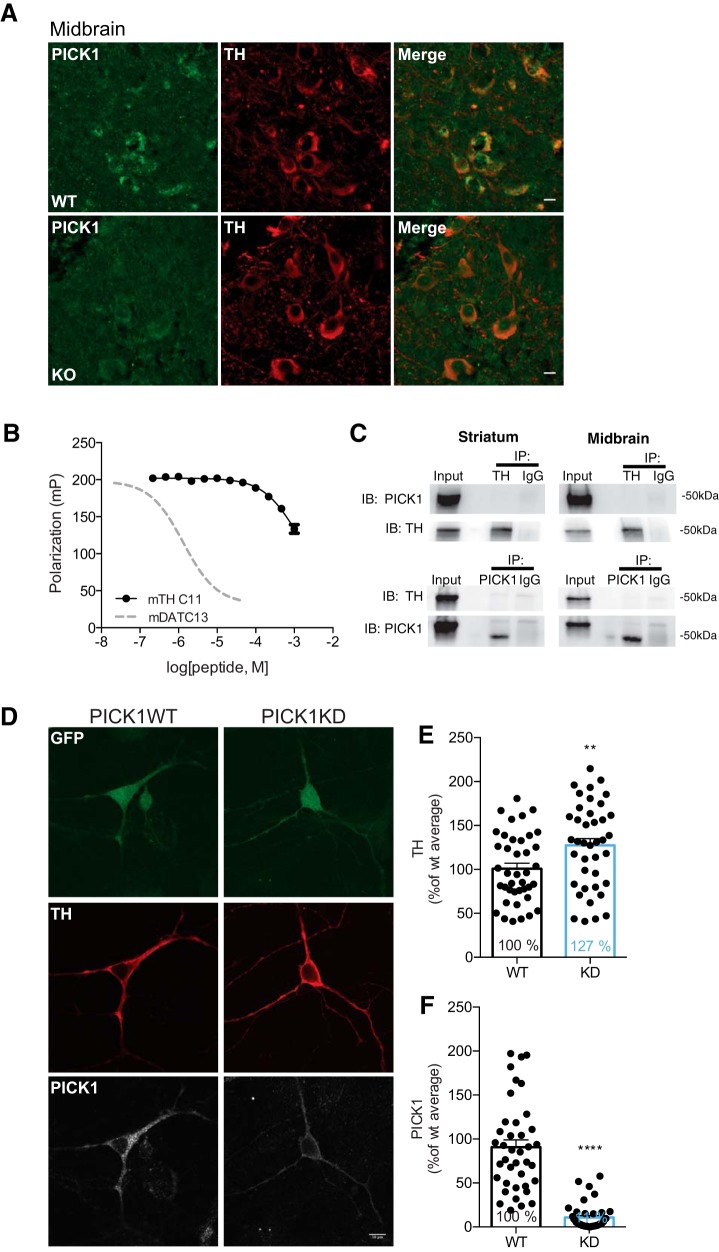
PICK1 is expressed in TH-positive midbrain neurons and lentiviral KD in midbrain dopaminergic cell cultures causes elevated TH expression. A, Immunohistochemical analysis demonstrates PICK1 immunofluorescence in TH-expressing neurons in ventral midbrain. Neuronal cell bodies in ventral midbrain show diffuse TH distribution in the entire cytosol while PICK1 immunofluorescence is clustered and polarized in the neuronal cell bodies. Scale bar: 10 μm. B, Competition fluorescence polarization indicates a non-PDZ-mediated interaction between TH and PICK1. Graph displays the competition of the OrgDAT with unlabelled TH-C11, corresponding to the 11 most C-terminal residues in TH or unlabeled DAT13 corresponding to the 13 most C-terminal residues in DAT (dotted line). C, Coimmunoprecipitation experiments from both midbrain and striatal preparations show lack of any direct interaction between TH and PICK1. Left upper left panel, IP of TH from striatum shows no co-IP of PICK1 (n = 3). Right upper panel, IP of TH from midbrain shows no co-IP of PICK1 (n = 3). Left lower panel, IP of PICK1 from striatum shows no co-IP of TH (n = 1). Right lower panel, IP of PICK1 from midbrain shows no co-IP of TH (n = 1). D, Representative confocal images of postnatal midbrain cultures of rat dopaminergic neurons, virus transduced with vectors containing the constructs for cytosolic GFP (left panel) or cytosolic GFP and the endogenous PICK1 silencing RNA sh18 (right panel). Scale bar: 10 μm. E, Significantly elevated TH expression in PICK1 KD versus wild-type neurons (t(78) = 2.68, p = 0.009; ∼127% compared to wild type). F, KD efficiency of the lentiviral PICK1 KD show significant reduction of PICK1 (p < 0.0001). All data expressed as mean ± SEM.

