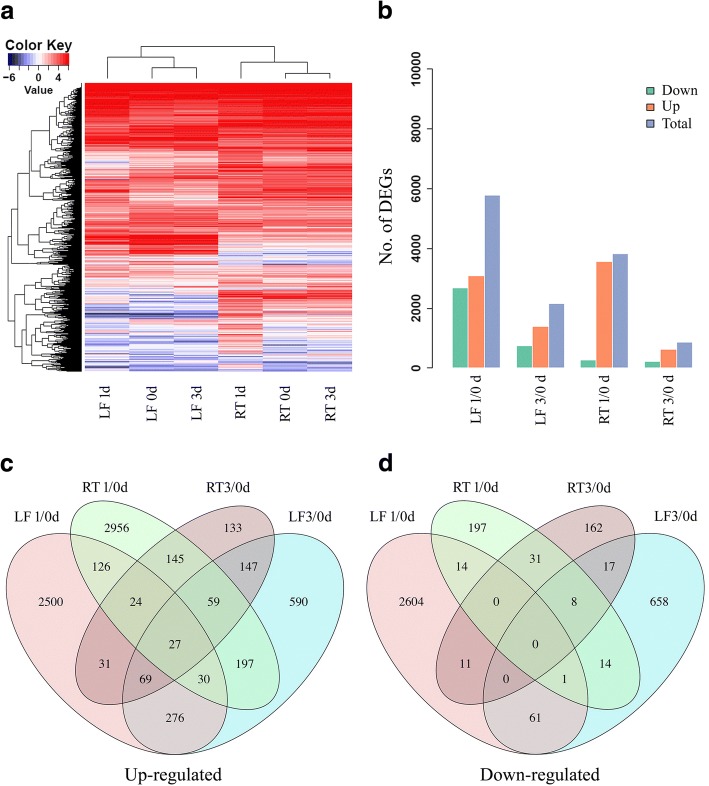
Fig. 2.
Variation in gene expression of BTH-sprayed banana plants. a The abundance of all of the expressed genes in leaves and roots; b) Comparison of the number of up- and down-regulated DEGs between treatments and control; c, d) Venn diagram represents the overlapping up- and down-regulated DEGs number between leaves and roots, respectively. LF, leaf; RT, root

