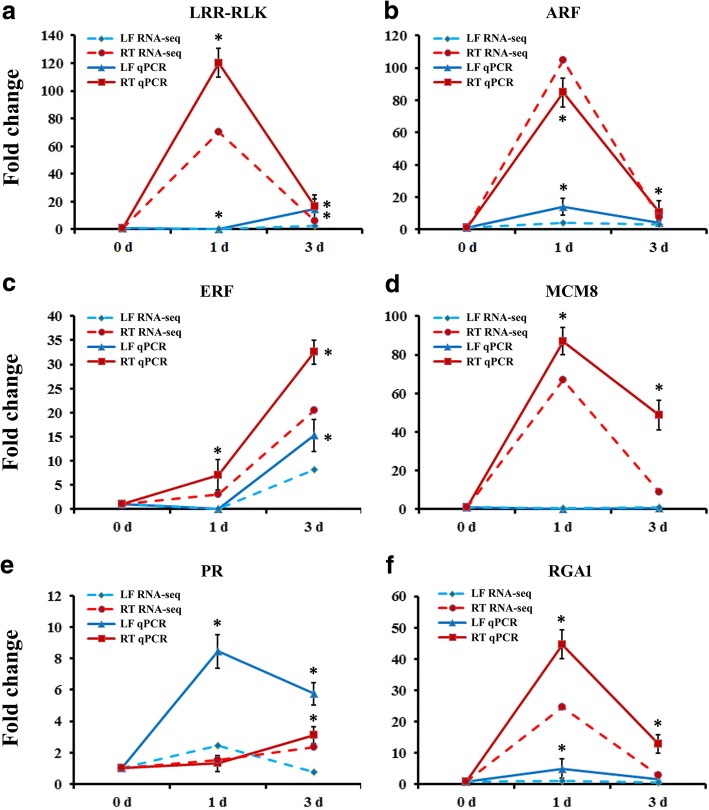
Fig. 7.
The expression profiles of 6 genes in banana leaves and roots by the quantitative RT-PCR. a-f The expression patterns of DEGs under BTH treatment by qPCR and RNA-Seq, respectively. MaACTIN was used as the reference gene. Data are presented as means ± SD of three independent assays. The asterisks indicate significant differences compared with the control treatment, *P < 0.01 by Student’s t-test. LF, leaf; RT, root

