Fig. 2.

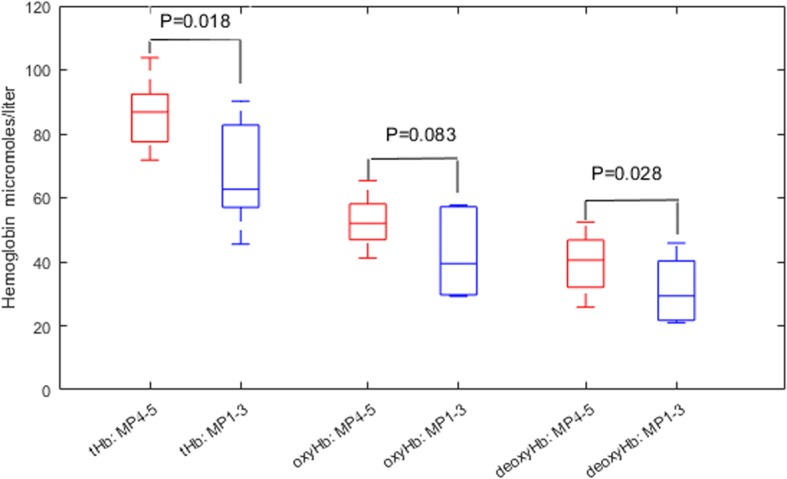
Box plot of pretreatment maximum total hemoglobin (tHb), oxygenated hemoglobin (oxyHb), and deoxygenated hemoglobin (deoxyHb) (μmol/L) of two responder groups. MP, Miller-Payne

Box plot of pretreatment maximum total hemoglobin (tHb), oxygenated hemoglobin (oxyHb), and deoxygenated hemoglobin (deoxyHb) (μmol/L) of two responder groups. MP, Miller-Payne