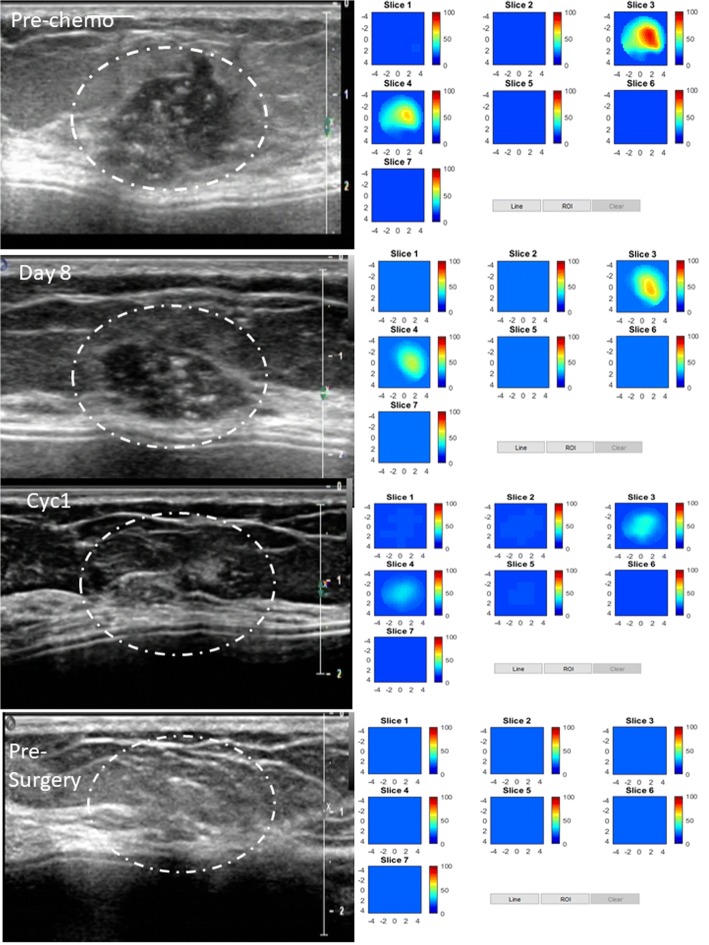
Fig. 4.
pCR in an HER2-positive tumor in a 51-year-old woman with a high-grade invasive ductal carcinoma treated with TPT every 3 weeks for six cycles. Left panel: US images obtained at pretreatment, at day 7, at the completion of cycle 1, and before surgery. Right panel: tHb concentration maps obtained at the corresponding time points. Each map shows seven subimages marked as slice 1 to 7, and each subimage shows spatial x and y distribution of tHb concentration reconstructed from 0.5 cm to 3.5 cm below the skin surface. The depth spacing between the subimages in depth is 0.5 cm. The color bar is tHb in micromoles per liter. This patient had a complete pathologic response with no residual tumor, Miller-Payne grade 5

