
FIGURE 4.
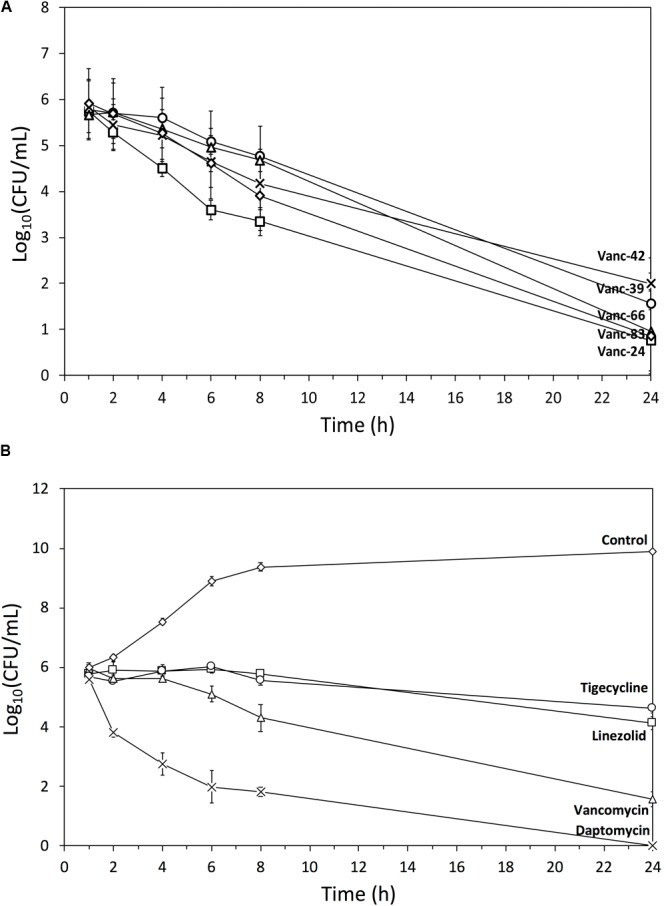
Time-kill curves. Semi-log plot of time-kill curves (n = 3, mean ± standard deviation) of MRSA exposed to a dose corresponding to 4x MIC of (A) Vanc-24 (□), Vanc-39 (○), Vanc-42 (x), Vanc-66 (Δ), and Vanc-83 (♢); (B) daptomycin (x), vancomycin (Δ), linezolid (□), tigecycline (○), and ultrapure water (♢) are shown.